Good day traders! Check now the most recent charts and market updates for today’s session. Learn more about analysis and be updated on the current happenings in the market!
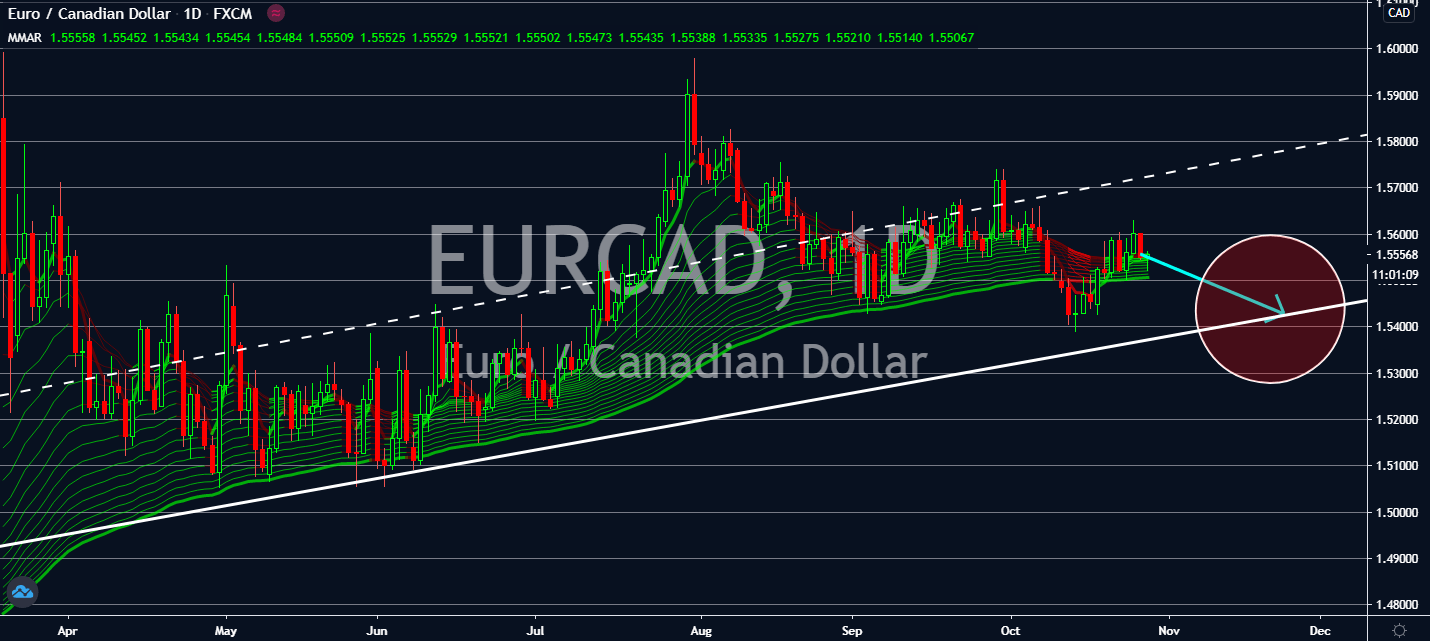
EURCAD
The Bank of Canada currently has its interest rate at 0.25%, which is higher than many developed nations. The central bank is likely to show a dovish tone towards the rate, given that Canada now surpassed the 10,000-threshold in Covid-19 death tolls. However, about 378,200 jobs were added in the country last month, and it had shown solid retail sales that could possibly lead to no change for its policy. Core inflation also lifted from 0.8% to 1% in September. Investors are counting on an improvement in consumer confidence for both Canada and its American neighbor, lifting optimism for its currency near-term. It looks like the euro will lower against the loonie because of this. Not only that: investors should consider that eurozone banks had tightened their requirements for loans in key economies such as Germany and France. Spain, which now has the second-most coronavirus cases in the bloc, was most affected by this move.
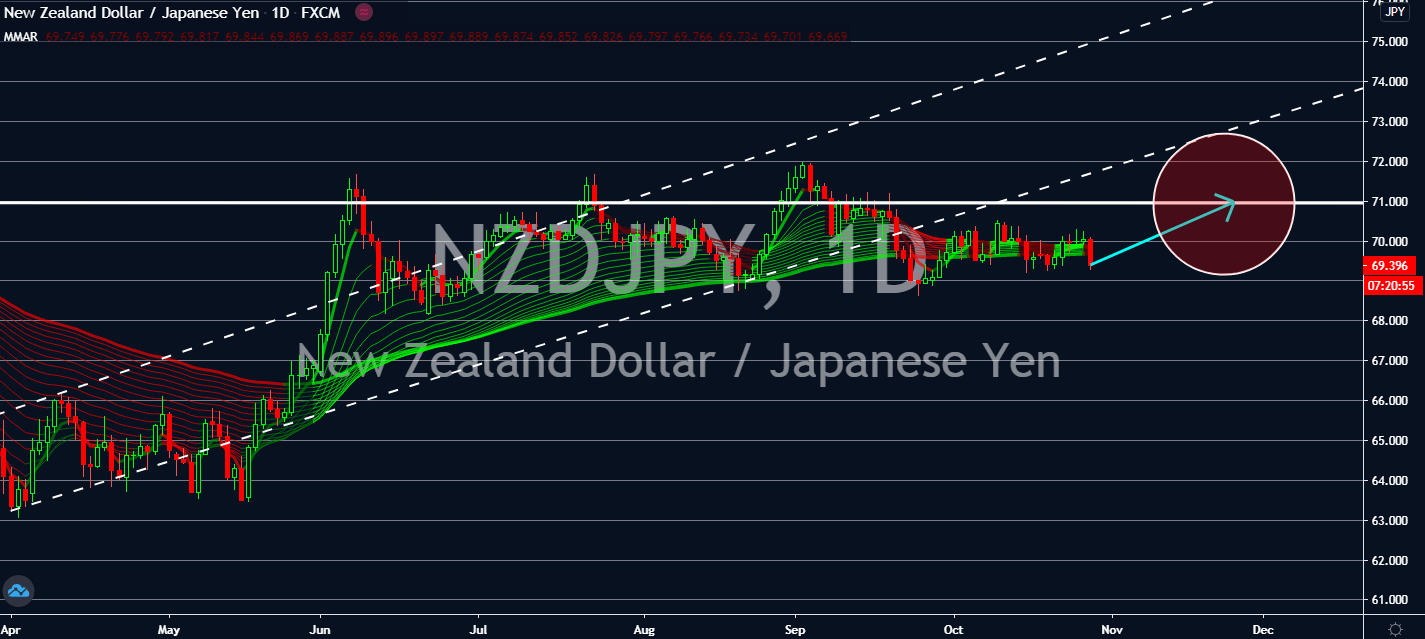
NZDJPY
Small business insights improved in New Zealand during the month of September. The average number of jobs in the small business sector rose by 0.9 percent in September after having fallen in August by 1.4 percent, a sign that indicates more growth in the sector than initially expected. Revenue in small businesses also went up by 3.4 percent in a yearly comparison throughout the month. Auckland’s Level 3 lockdown in September didn’t seem to stop activity to recover its losses throughout August. The improvement had improved confidence in the kiwi dollar, as well. Although the figure is still at a negative 11 percent rate within the month, it was still a significant improvement from the negative 25 percent seen within the quarter ending June. As the Japanese economic calendar remains quiet, the kiwi dollar is projected to rise over the seen progress in the New Zealand economy. This could change only if Japan reports any catalysts.
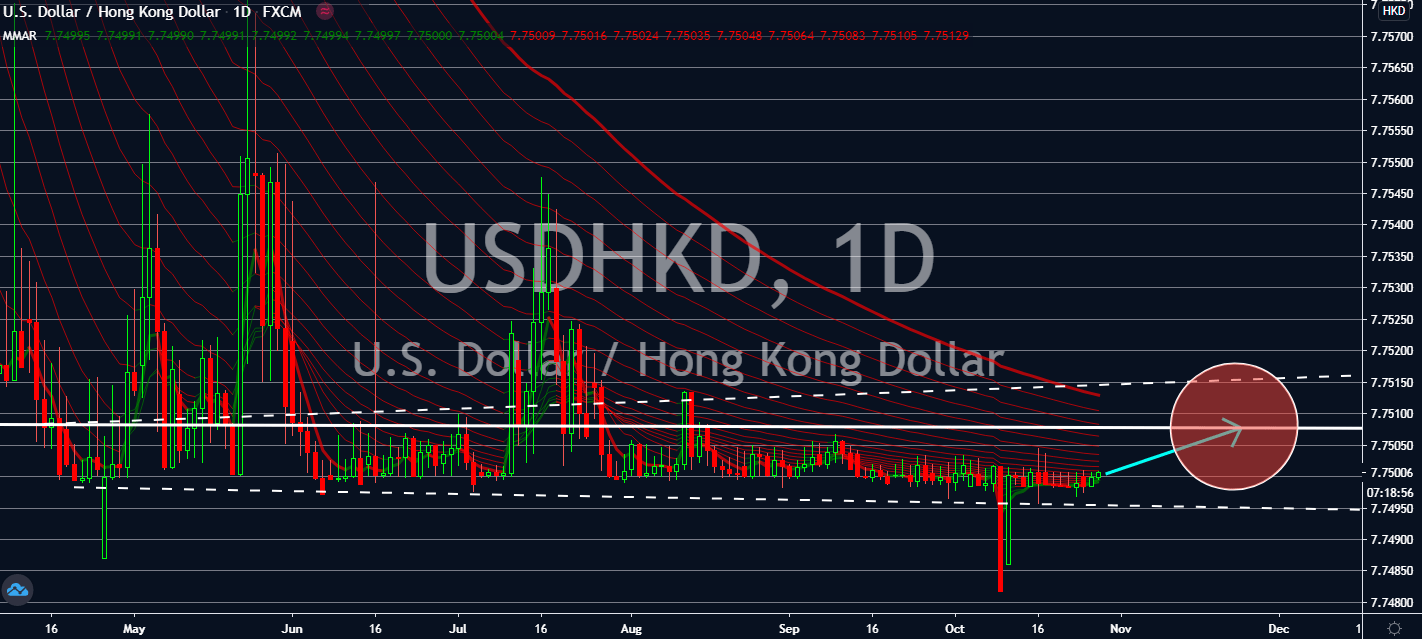
USDHKD
More investors are worried that Hong Kong’s private sector debt has gone too high for it to recover within the year. Companies are piling debt on debt at the fastest pace in history, according to the Bank of Settlements. Debt service ratio for the private sector reached a 29.8 percent high in March, effectively higher than 32 economies. The rate had nearly doubled in comparison to a decade earlier, which came in at 16.5 percent. For reference. Norway’s debt service ratio topped 27.9 percent. Economists claim that this means the economy is in the “danger zone.” It looks like the ratio will remain high over the next year due to the Federal Reserve’s ultra-low interest regime, which will motivate bullish traders to keep pushing the greenback up against its Hong Kong counterpart. Now that the US is one week away from its presidential elections, investors claim that an upcoming trillion-US dollar economic aid will keep the safety of the dollar up.
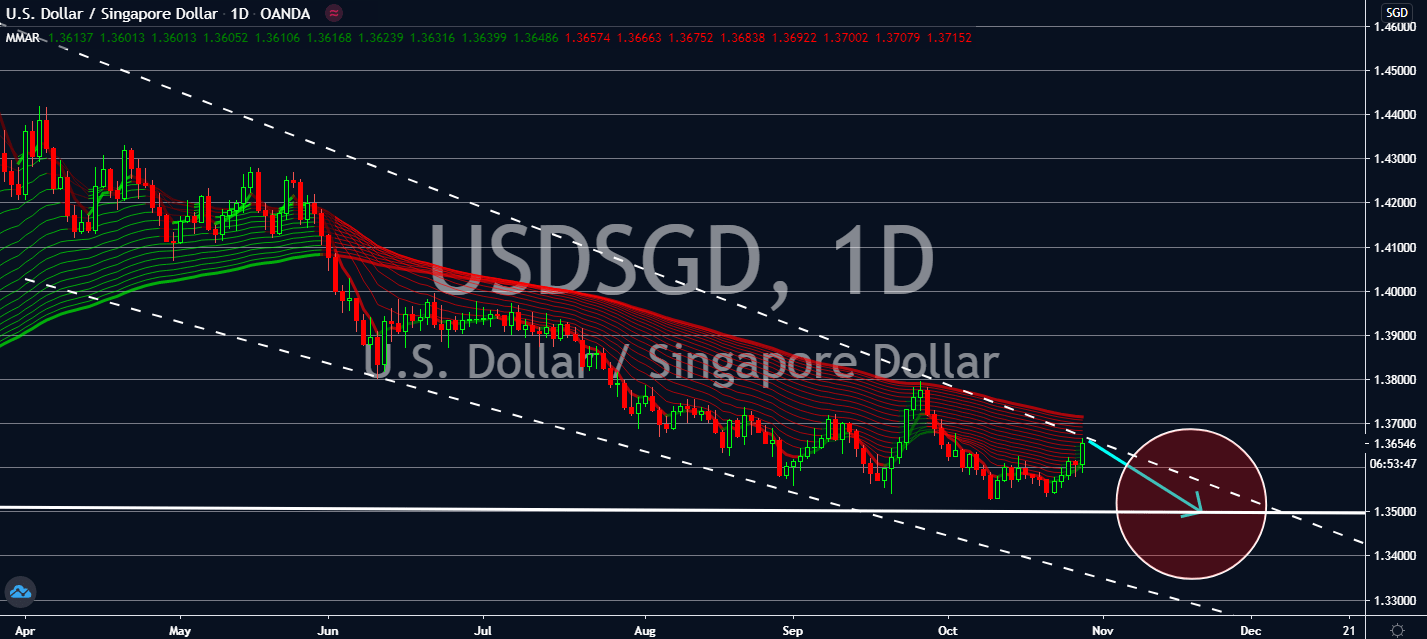
USDSGD
The comparison of coronavirus cases will be the determiner of the pair’s near-term track. Notably, economists are pessimistic about the economic recovery in Singapore. Experts keeping a close eye on its recovery claim that its economy wouldn’t be able to recover to pre-coronavirus levels until 18 months from now, which is twice as long as earlier recessions. However, it still managed to suppress the number of cases it had seen earlier this year. Investors are expected to keep a cautious bullish trend for the pair as the world keeps a close eye on the presidential elections on November 3rd, after which will determine what the US government will do to battle the economic and fiscal effects of its most recent wave. Analysts have also been warning investors of what could look like a full recovery in the United States as they await the Commerce Department’s possible announcement on Thursday for a record-setting growth in gross domestic product.