Good day traders! Check now the most recent charts and market updates for today’s session. Learn more about analysis and be updated on the current happenings in the market!
USDBRL
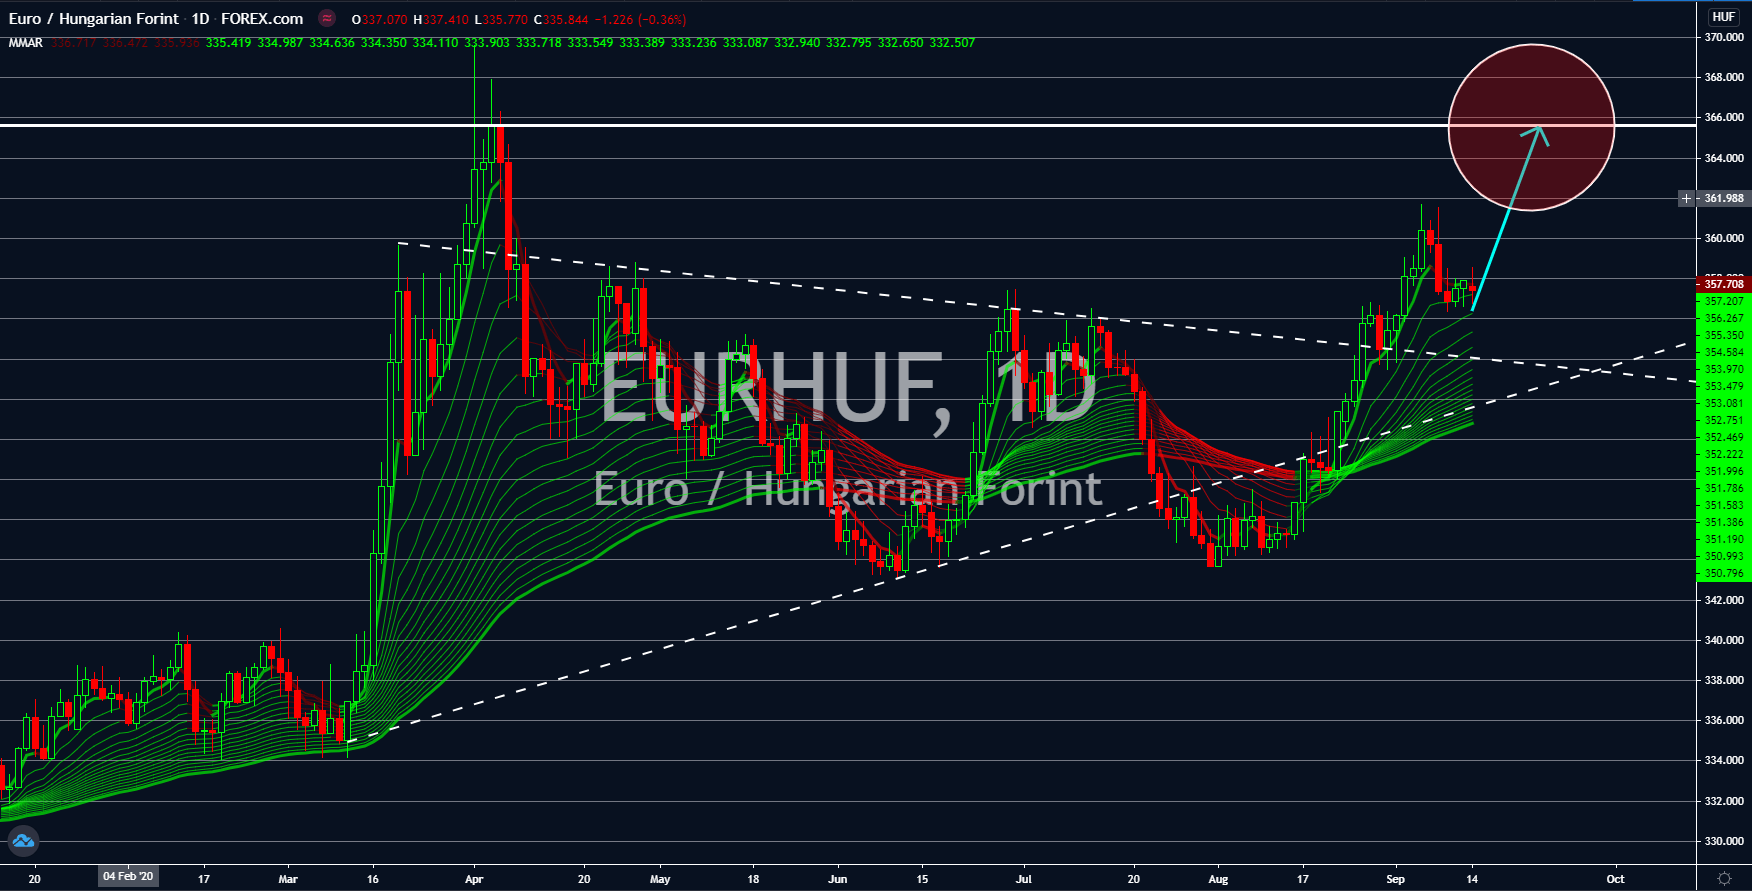
The US dollar will continue to thrive against the Brazilian real in coming sessions. This was despite the overall weakness in the demand of the American currency in the global market. Last week, Brazil posted mixed results from its Retail Sales report and Service Sector Growth MoM report. The largest economy in South American recorded an increase of 5.5% on its retail sales for the month of July. This was more than twice the expectations of 2.2% by analysts. Also, this month’s report beat its previous result from July of 0.5%. However, the opposite is true for its service sector. Despite growing by 2.6% in July, the result was far from the 3.1% expectations and from its previous record of 5.0%. Meanwhile, the United States is getting back on its feet as last Thursday’s initial jobless claim figure stayed below the 1 million mark. The report added 884K claimants from last week, a bit higher from the previous week’s 881K.
USDRON
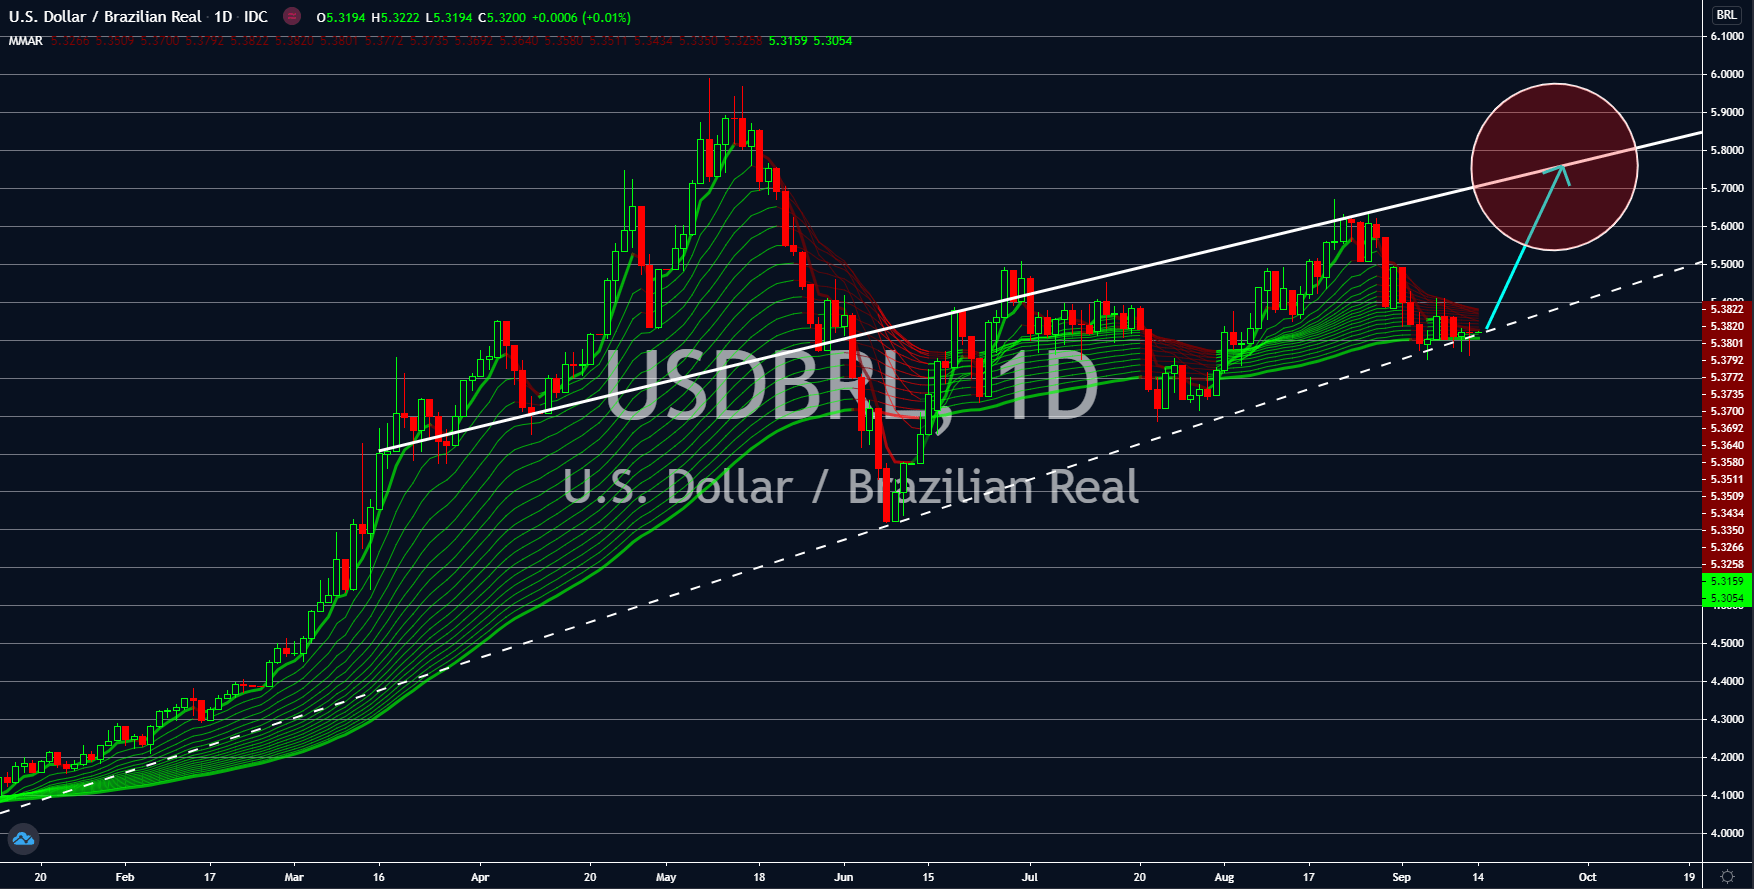
An accumulation of the USDRON pair is seen between the $4.10 and $4.50 price level. This suggests that a strong report from the US or a weak data from Romania could trigger a rally for the pair. As for Romania, it recently released its Industrial Production report that divided analysts. Figure came in at 3.3%. Although it stayed above the positive territory, it created a huge gap with its previous result of 16.2%. Also, industrial production is still lagging by 7% compared to its pre-coronavirus level. On the other hand, US investors were revitalized as initial jobless claims continue to stabilize at 850K level. The past two (2) weeks has recorded the lowest increase in claimants. However, investors are skeptical whether the US dollar will be able to defend its current value following the increase in crude oil inventories with its recent report. Inventories climbed by 2.032 million following 6 weeks decrease in US oil inventories.
EURNOK
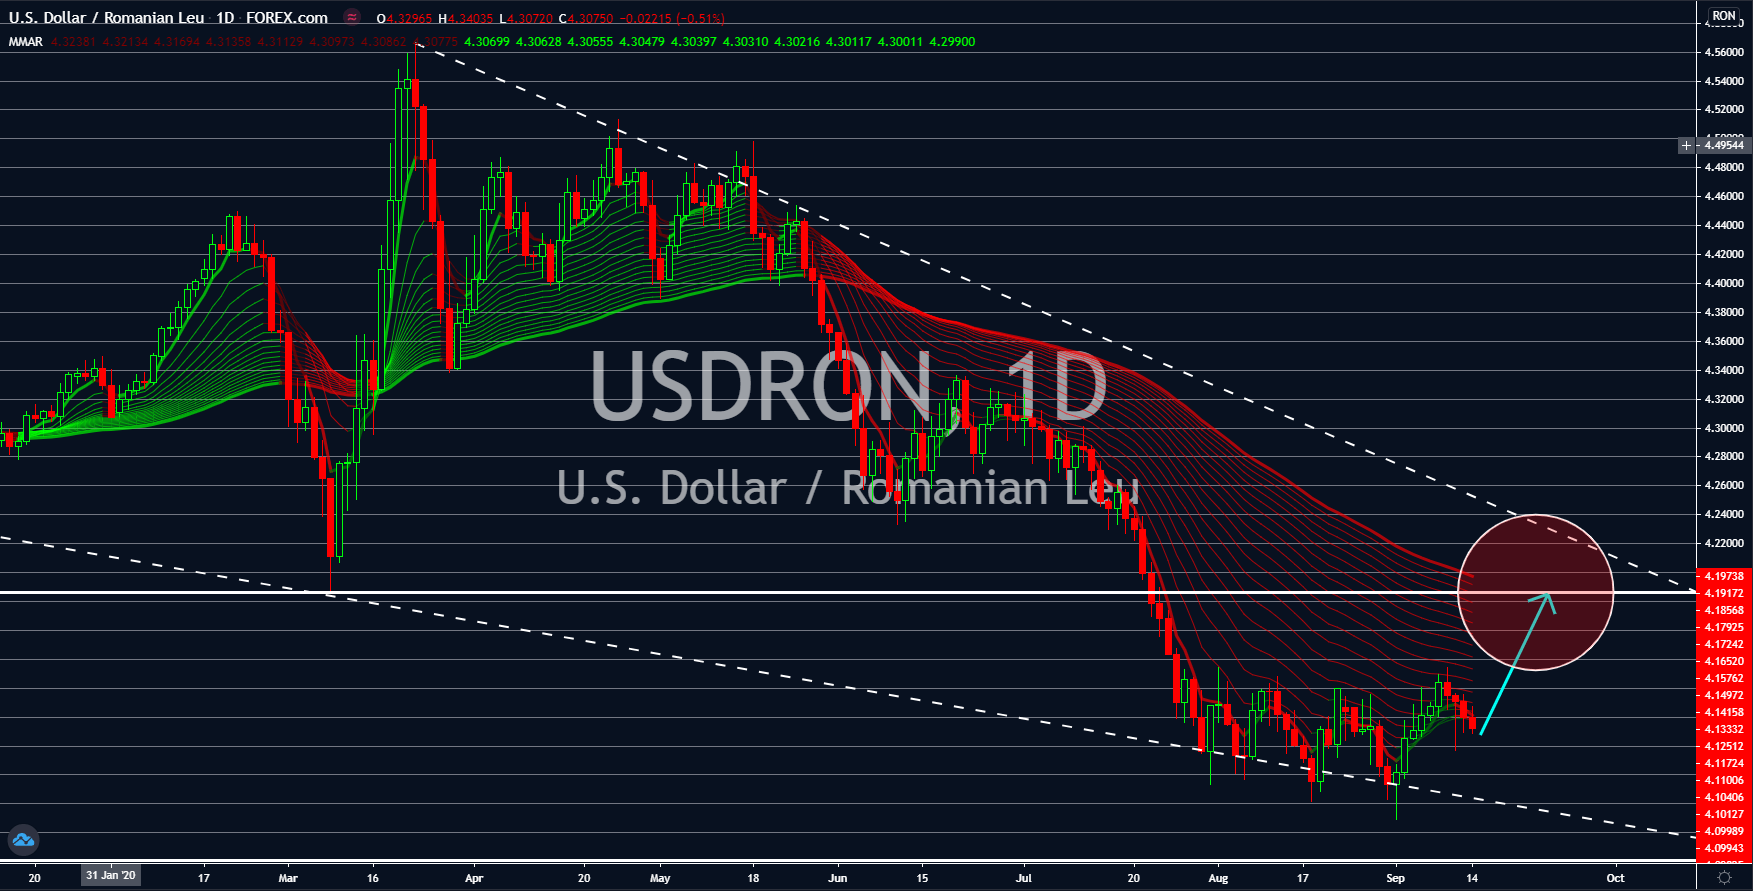
The EURNOK pair is expected to see new lows in coming sessions. Just last week, the pair broke out of the triangle formation as investors became more confident of the economic health of the European Union. However, a more stable data from Norway would eventually shift this optimism from the single currency to the Norwegian kroner. The EU published a better-than-expected result for Eurozone Industrial Production MoM. Figure came in at 4.1% compared to expectations of 4.0%. However, this result was half the data recorded for the month of June at 9.5%. On the other hand, Norway’s CPI YoY managed to meet analysts’ expectations and beat its previous month’s record. The number reported on Thursday, September 10, was 1.7% while its figure from the previous month was 1.3%. Aside from that, despite posting negative figures for PPI, investors were still optimistic. The -12.1% data represents that third consecutive growth in the report.
EURHUF
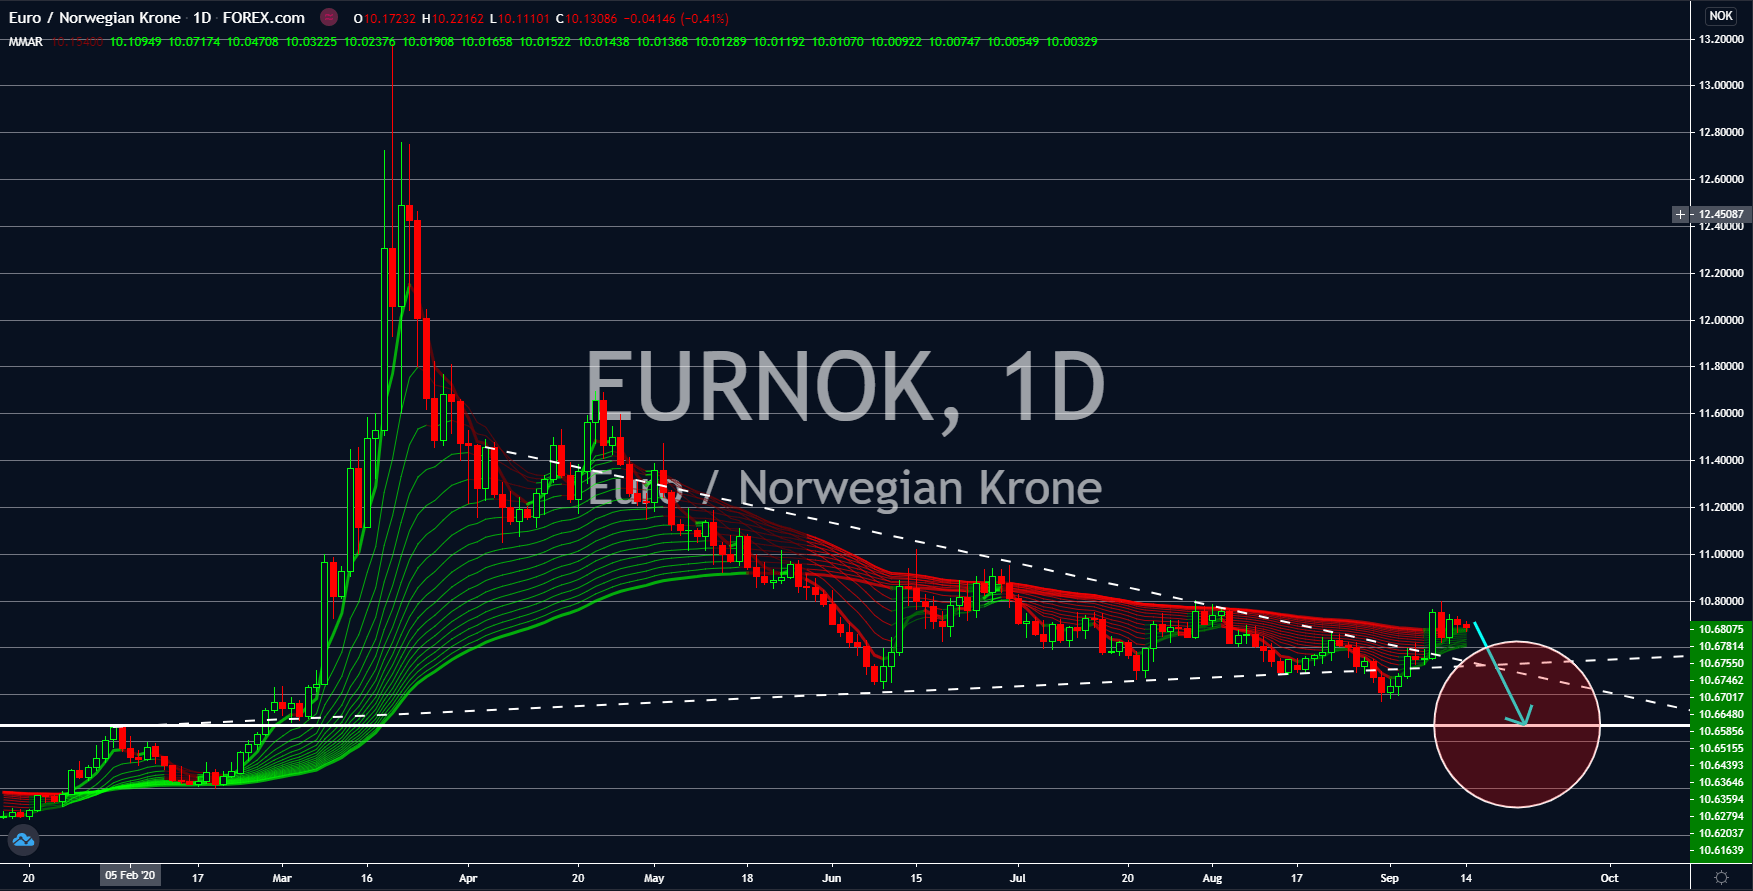
The spike of new COVID-19 cases in Hungary over the weekend renewed the fears of investors. On Saturday, September 12, Hungary recorded its highest single day increase of coronavirus positive at 916. Meanwhile, its neighbor Czechia recorded more than 1,500 new cases in a single day, its second highest single day increase. These alarming figures might hold back the economic prosperity that eastern Europe are currently experiencing due to the slowdown in western Europe. Furthermore, the statement by the populist leader of Hungary, Viktor Orban, struck more fears from investors. Orban said he won’t impose a school closure which could further heighten the number of infected people in Hungary. As for the country’s economy, industrial output YoY was still stagnant at an average of -8.0% for the past two (2) months. Figure for the report came in at -8.1% for the month of July which was higher from the 7.8% figure in June.