Good day traders! Check now the most recent charts and market updates for today’s session. Learn more about analysis and be updated on the current happenings in the market!
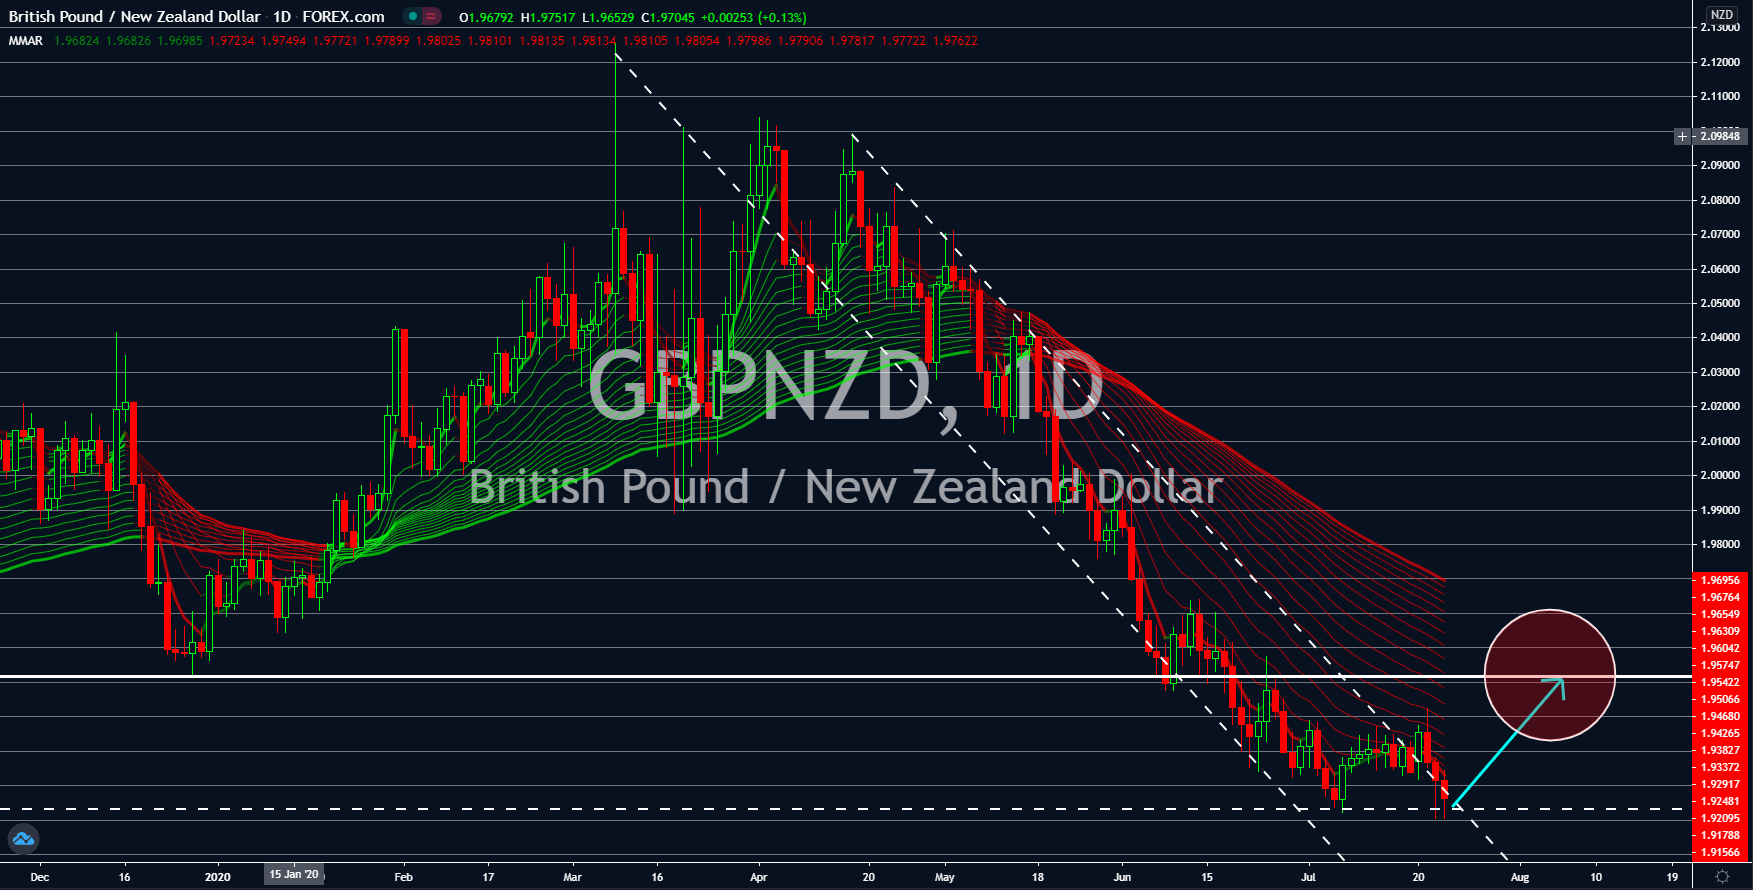
GBPNZD
The bi-monthly report of the UK GfK Consumer Confidence is expected to pick up in the first half of July. Expectations were at -26 points compared to the second half of June at -27. The highest recorded decline of consumer confidence was in April. During this time, there is only one (1) figure given for the entire month. The decision to release two (2) figures for a month was made to lessen the impact of the report on the British pound. Aside from the United Kingdom, New Zealand will also release several key reports today, July 23. Among these were the import, export, and trade balance reports. Despite not having any estimates on its import report, the trend shows a continuous decline. Prime Minister Jacinda Ardern kept its borders close despite reopening the country’s economy back in June. Meanwhile, the trend also shows export gaining momentum. The imbalance between import and expert will affect the current economic chain in New Zealand.
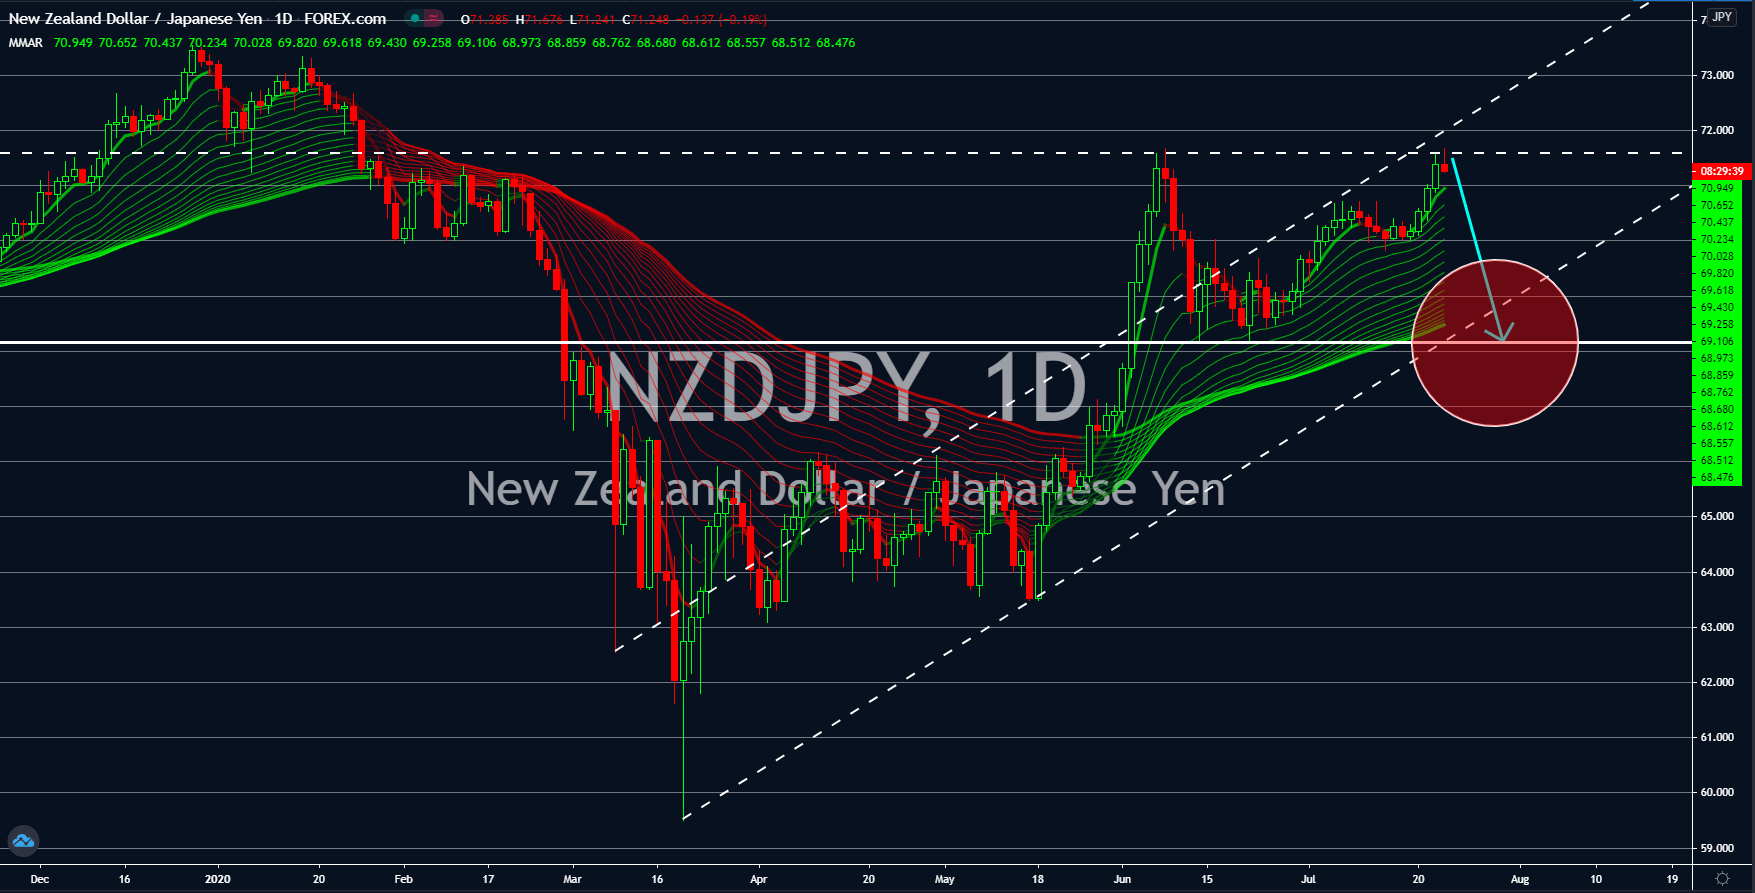
NZDJPY
The pair might have reached the peak, the same as Japan might already have hit the bottom. Currently, the pair is trading on its June 08 high and investors were looking for signs to continue pumping the New Zealand dollar. However, they might be disappointed with the weak import expectations based on its trend. As the country limits the influx of people and products coming from other countries, it is hurting its long-term economic prospect. The trade quota among countries that New Zealand might have a bilateral agreement with will eventually hit back the country in the coming months. The figures for import, export, and trade balance reports were $4.14 billion, $5.39 billion, and $1.25 billion, respectively. On the other hand, Japan posted positive figures for its Manufacturing and Services Purchasing Managers Index (PMI) reports. Figures came in at 42.6 and 45.2, higher than their previous record of 40.1 and 45.0, respectively.
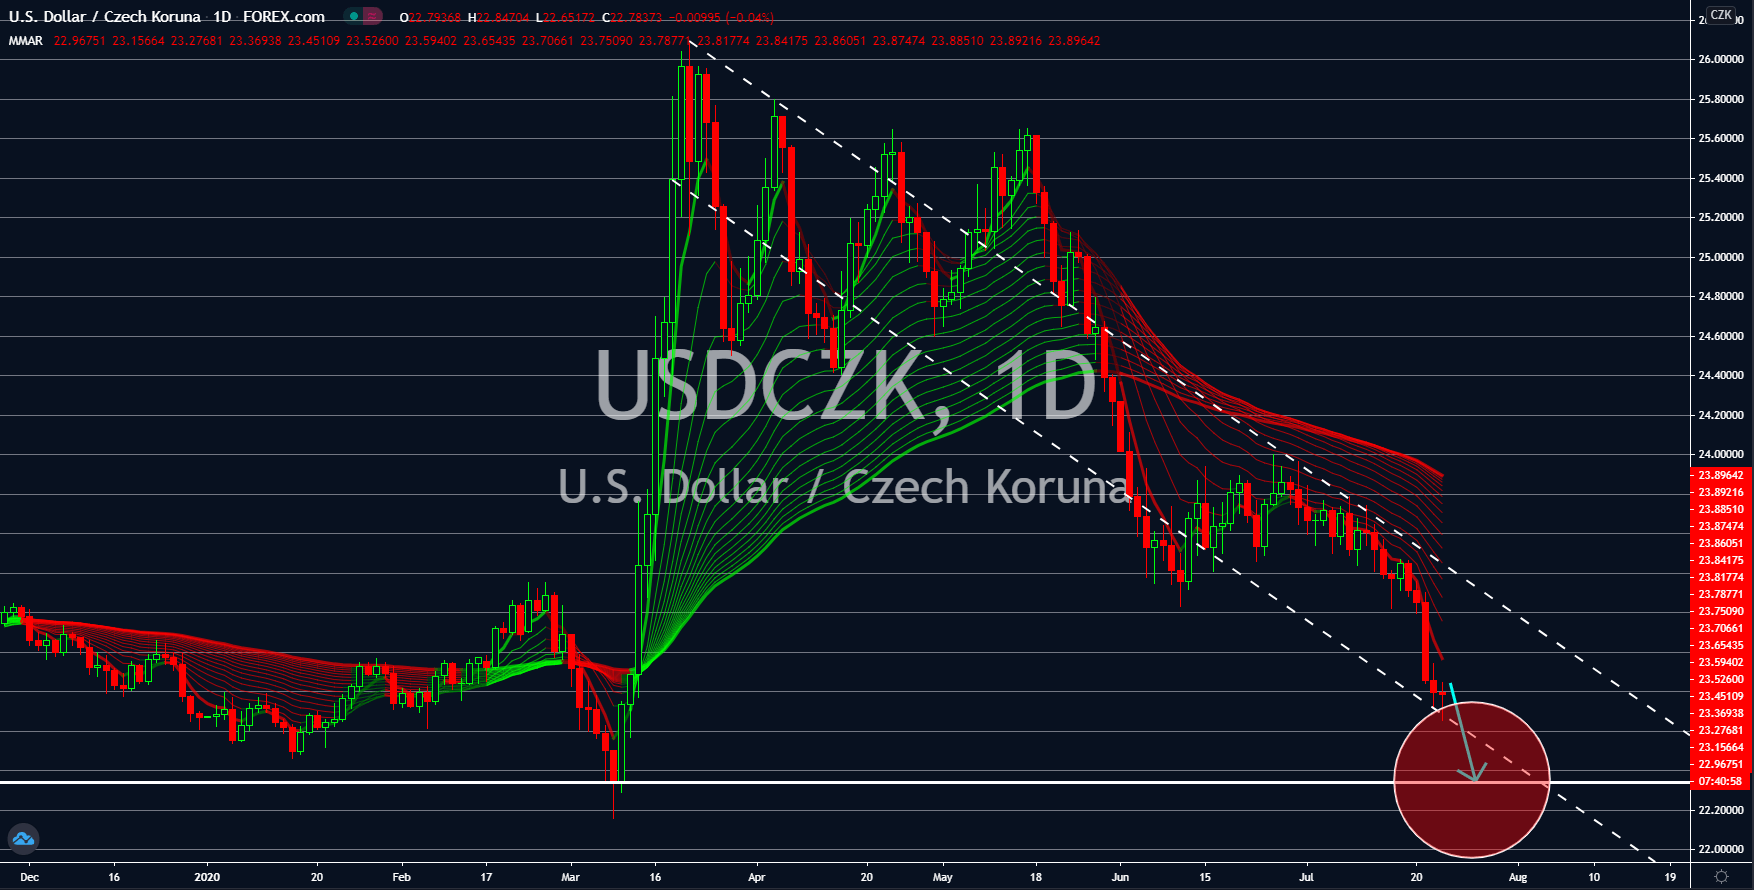
USDCZK
On July 17, Czech Prime Minister Andrej Babis arrived in Brussels for the European Union leaders’ summit. During his arrival speech, he mentioned that the distribution of the recovery fund should be allocated based on the impact of COVID-19 on each member’s economy. He argued that the country’s unemployment rate and debt-to-GDP figures were alarming. In July 07, the Czech government posted a 3.7% unemployment rate, the highest since the pandemic began in the second half of March. This figure was higher by 23.33% compared to the pre-pandemic figure of 3.0%. Meanwhile, its debt-to-GDP ratio is expected to reach by 39.10% or almost half of its GDP. In 2019, the figure for this report was only at 30.8%. In the US, a recent report shows initial jobless claims beginning to soar once again. The figure for today’s report was 1,416K which is higher compared to its figure from last week at 1,300K, a 116K difference.
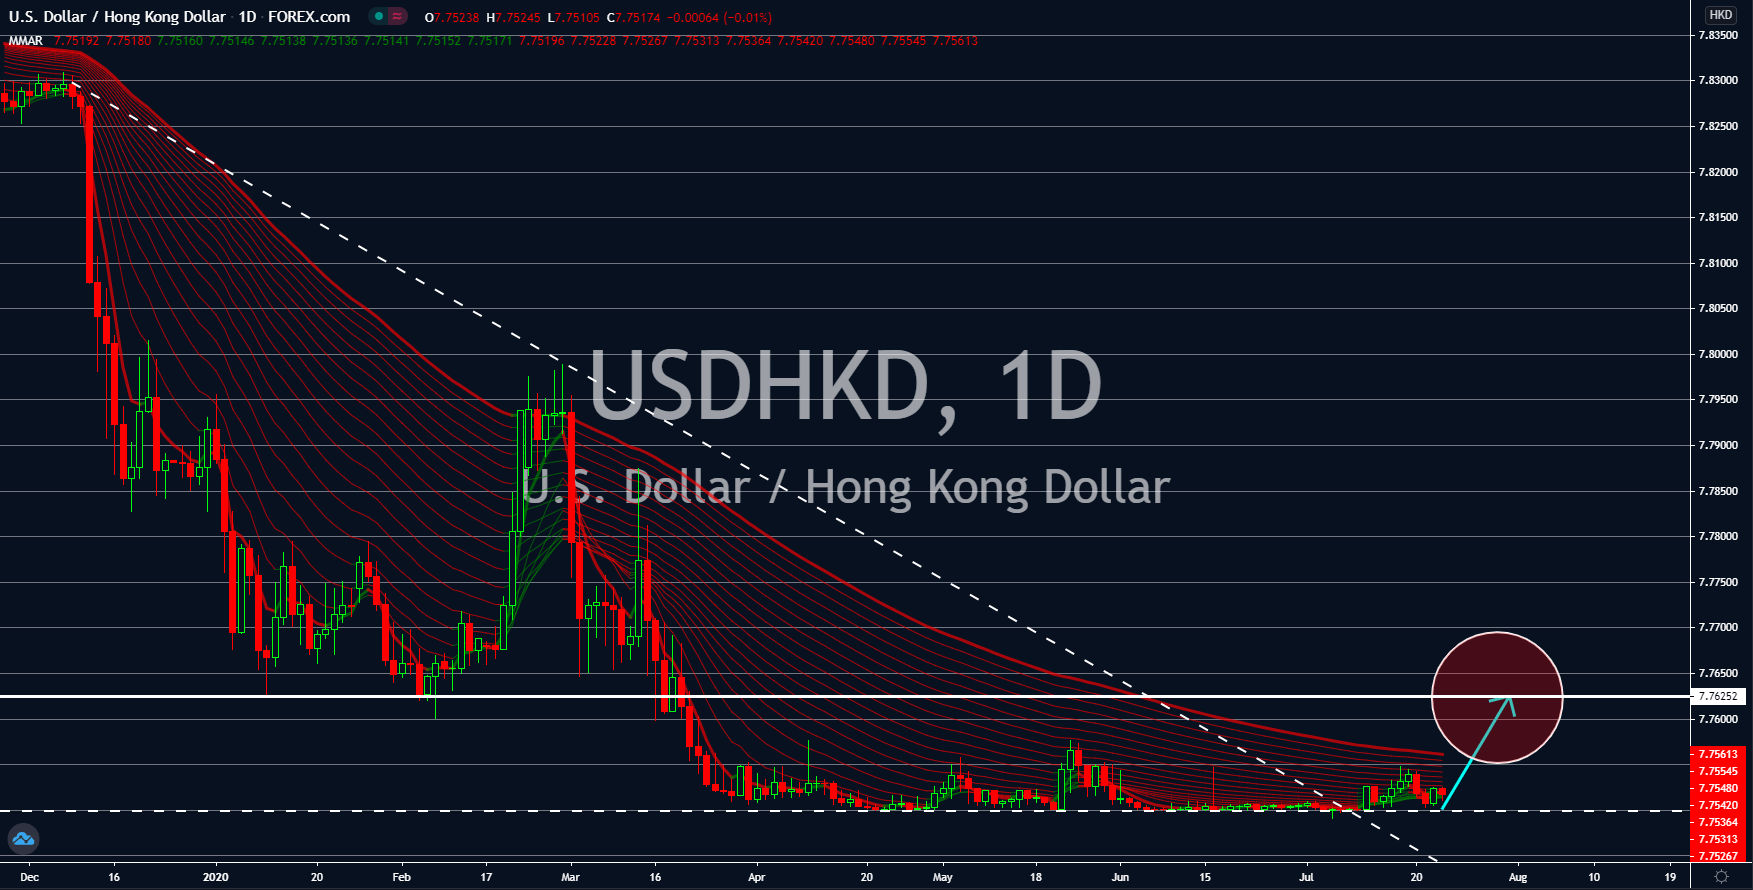
USDHKD
The US dollar is bound to weaken against currencies pegged against it, but not for the Hong Kong dollar. The US initial jobless claims saw an increase in number in today’s report, July 23. The increase in the number of people filing for unemployment benefits was the first time since the downward momentum began during the second week of April. However, the huge unemployment rate in Hong Kong is expected to push the HKD lower in the coming sessions. On Monday, July 20, the Hong Kong government posted a 6.2% unemployment rate, the highest since the SARS outbreak from 2002 to 2004. Also, on Tuesday, July 21, its Consumer Price Index (CPI) report saw its lowest figure since 2017. As the tension between the United States and China continues to escalate, analysts are expecting Hong Kong’s economic figures to continue to disappoint investors. In other news, the US says it is considering ending Hong Kong’s special trading status.