Good day traders! Check now the most recent charts and market updates for today’s session. Learn more about analysis and be updated on the current happenings in the market!
USDSGD
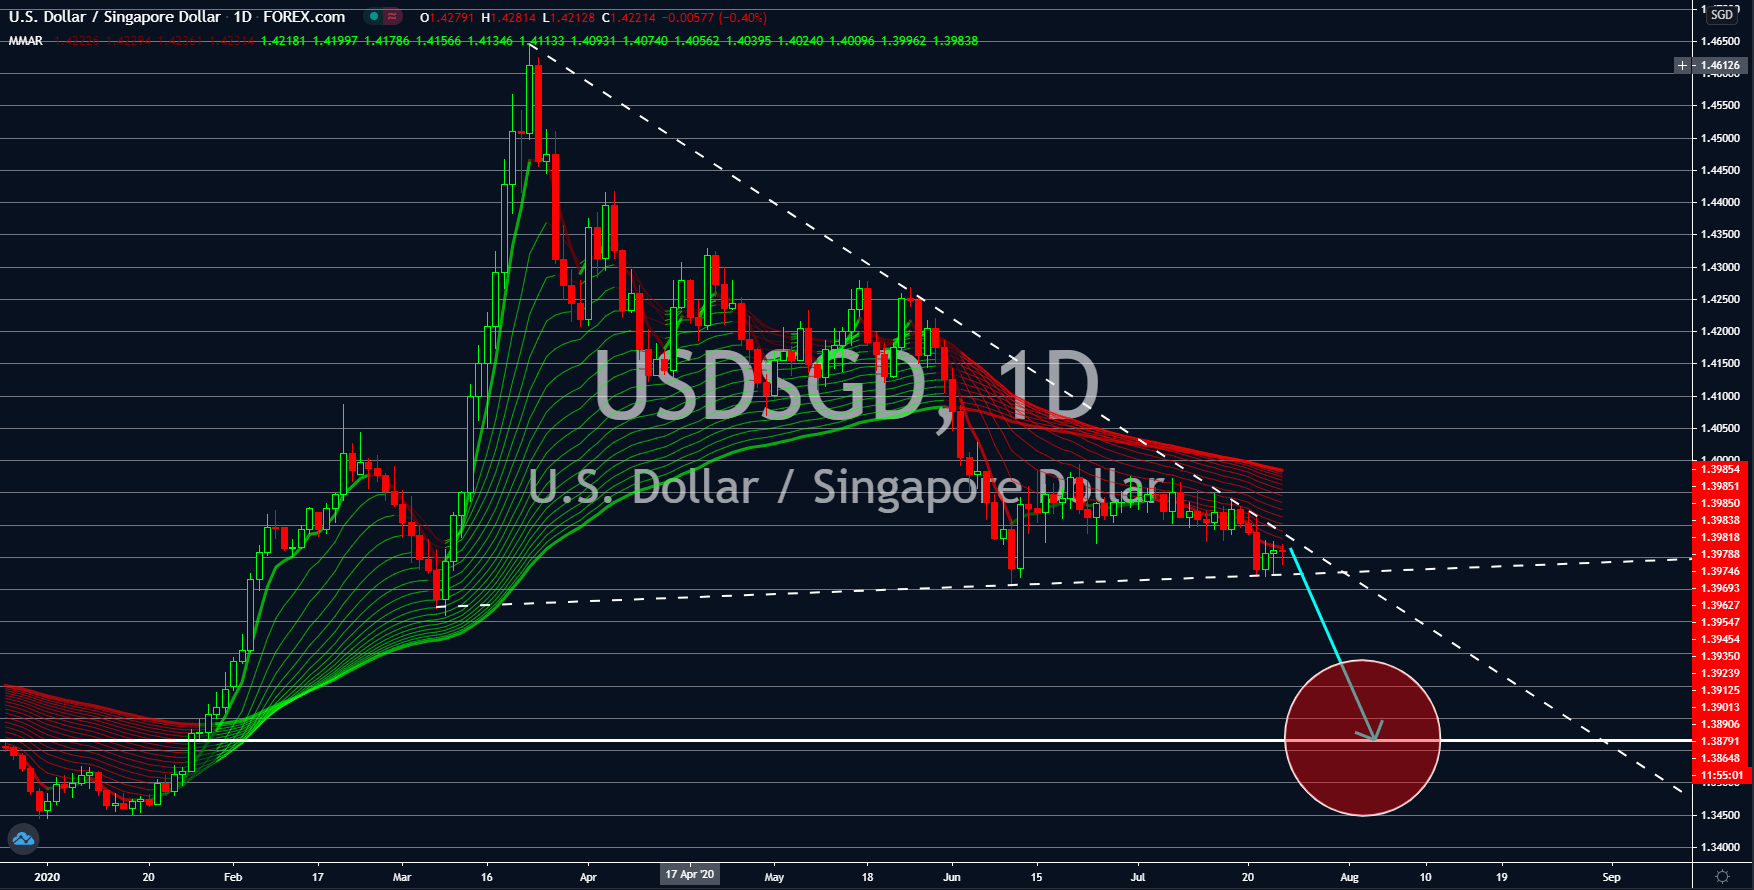
It is a race to the bottom for the United States and Singapore. The two (2) economies posted reports this week that surprised investors. For Singapore, it unveiled its Industrial Production MoM report today, July 24. Expectations by analysts were placed at 10.3% growth following the reopening of Singapore’s economy in May. However, the Singapore government disappointed investors after it posted 0.2% growth instead. The huge difference in the actual and expected value in industrial production will hurt the Singapore dollar against currencies pegged on it, but not for the US dollar. Yesterday, the US reported the most-awaited initial jobless claims. Since its high in the last week of March, it only saw a decline in the number of people filing for unemployment benefits. However, yesterday’s report goes against the trend. The figure for initial jobless claims was 1,416K , higher than the 1,300K expectations for the second week of July.
EURDKK
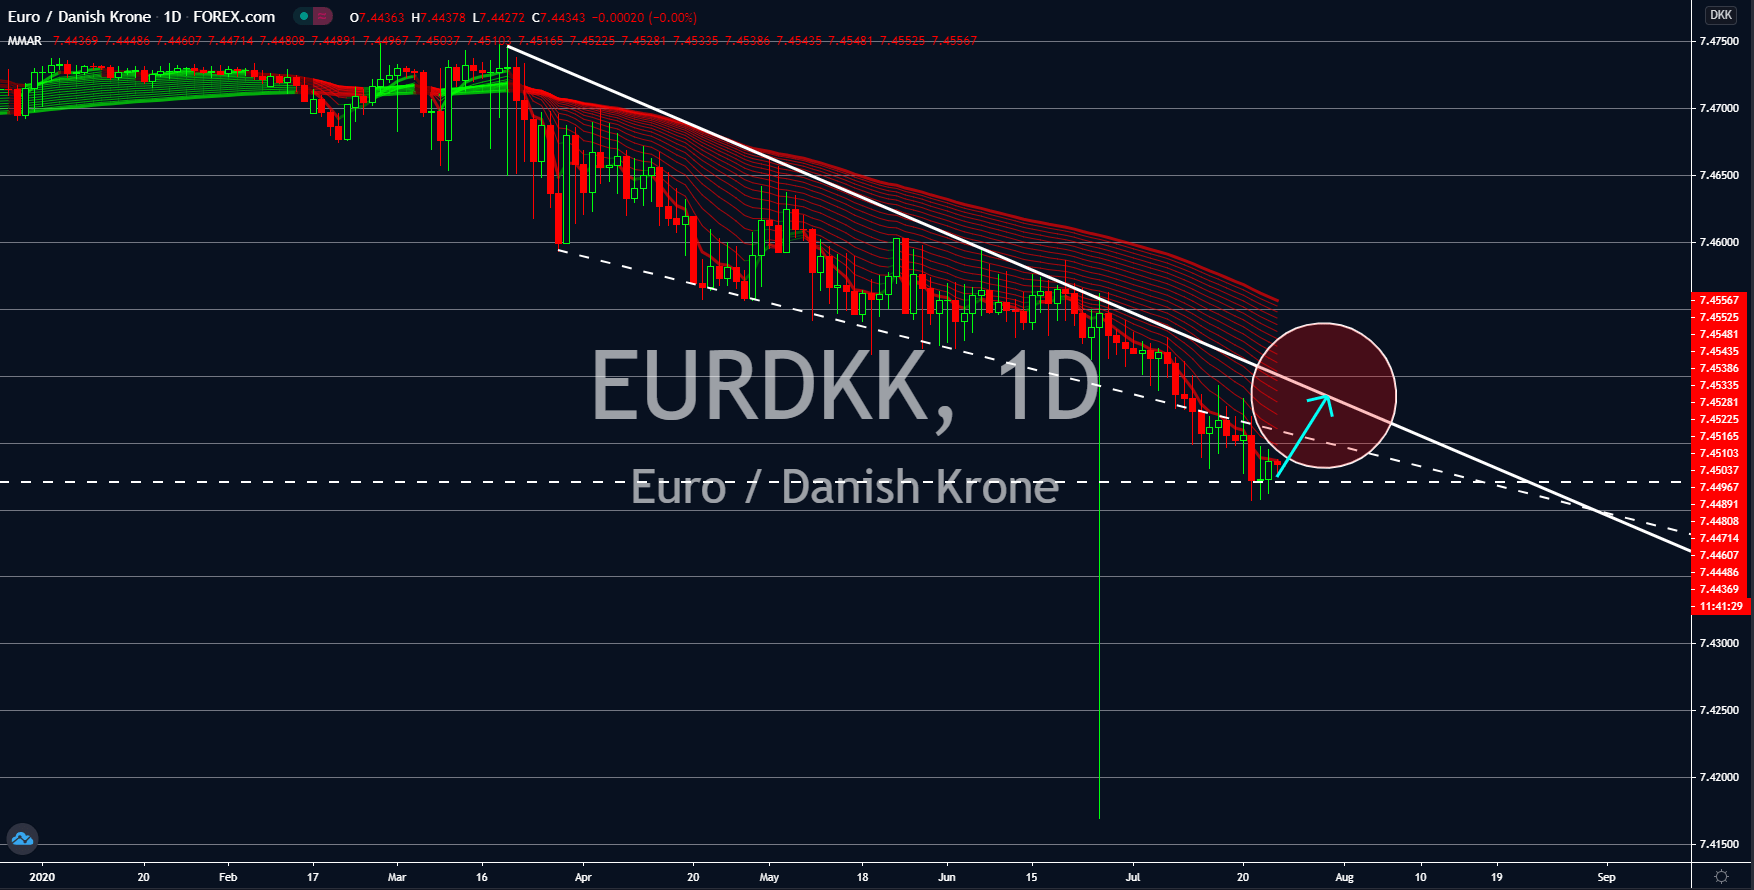
The recent reports for European countries suggest that the region is now recovering from the pandemic. Denmark made a small improvement on its Consumer Confidence report that was published yesterday, July 23. Figures came in at -2.9% for July compared to -3.1% in June. Despite the improvement, however, the members of the Eurozone are advancing at a faster pace. Germany and France both posted above 50 points growth on Manufacturing, Services, and Markit Composite Purchasing Managers Index (PMI) report. This was also the same case for the Eurowide report on these areas. A reading above 50 points suggests that the improvement for a specific report was above the baseline. Meanwhile, below 50 points figure indicates a contraction. The hardest hit European economy, Italy, is also showing a major improvement. Italian Trade Balance on non-EU partners rose to $4.44 billion for June compared to $4.15 billion in May.
EURTRY
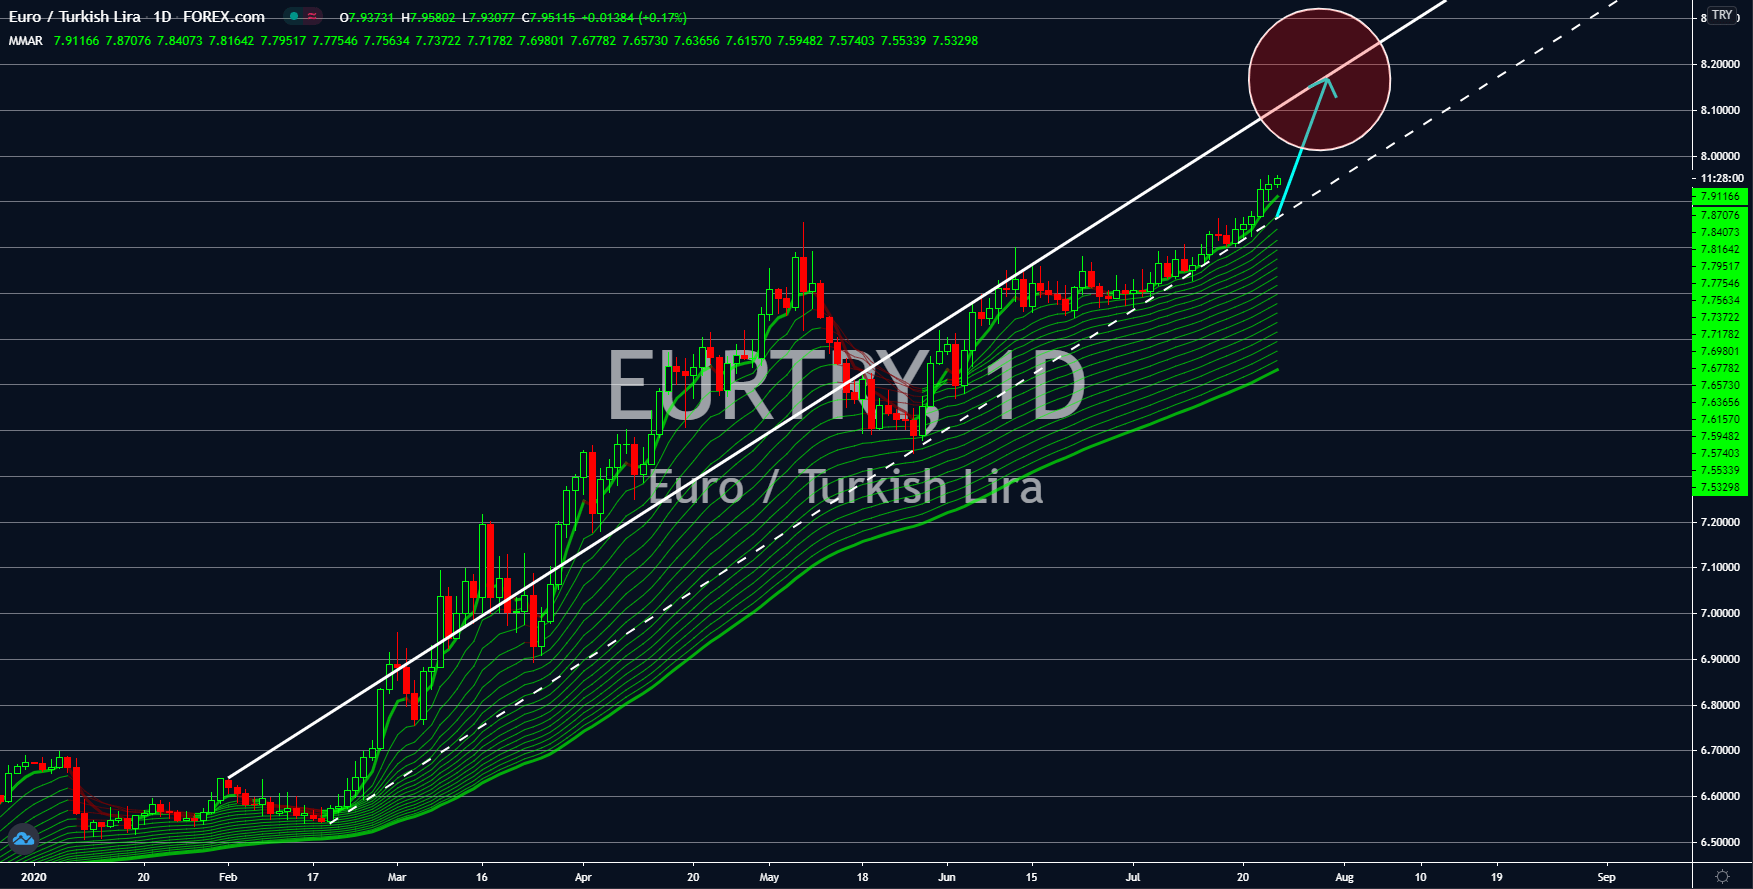
A clear trend for the pair in the coming months is more visible with the better-than-expected reports from the European Union. Manufacturing PMI figures for Germany, France, and the European Union came in at 50.0, 52.6, and 51.1 points, respectively. On the other hand, Services PMI also posted above 50 points figures at 56.7, 57.8, and 55.1, respectively. This indicates that the service sector in the European Union is thriving during the coronavirus pandemic. Meanwhile, the work from home scenario of most companies in the EU for their employees is dragging the manufacturing industry. Despite this, the figures for manufacturing PMI still managed to grow beyond 50 points. As more economies began to reopen their economies, Turkey is moving backwards. Its refusal to ask financial help from global financial institutions like the World Bank and the International Monetary Fund (IMF) is crippling its economy.
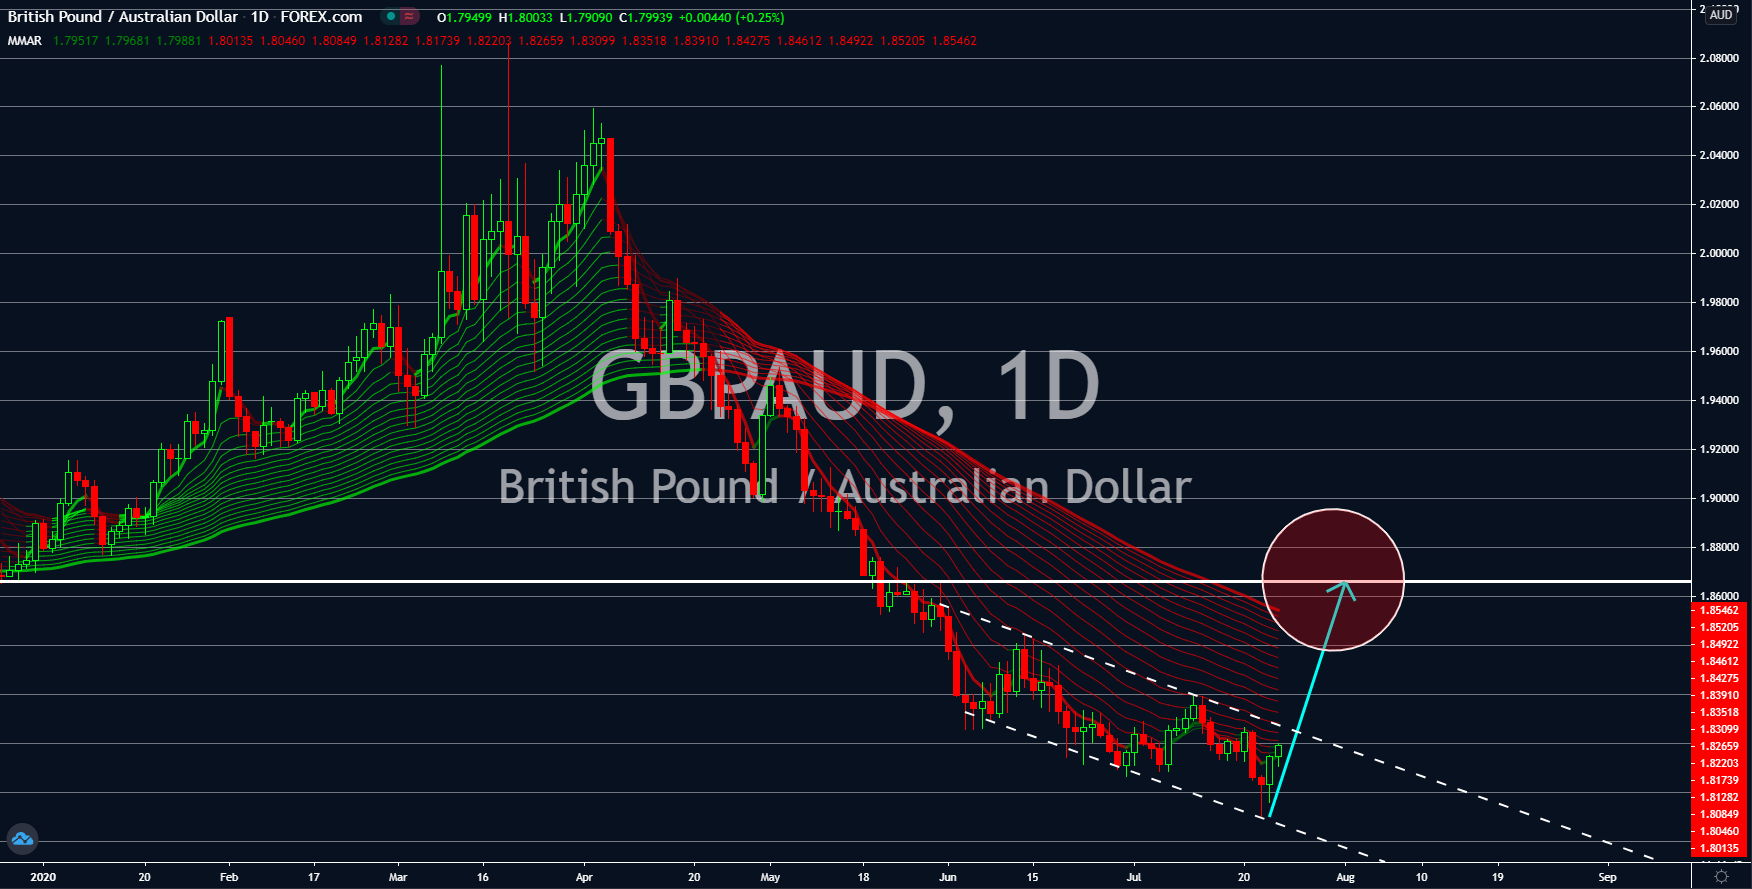
GBPAUD
As economies reported their Manufacturing and Services Purchasing Managers Index (PMI) reports today, an unlikely country made the list of those who reported above 50 points figures. The United Kingdom replaced Italy and Spain as the European country with most cases of COVID-19. Due to this, many analysts set a bearish tone on the country’s upcoming reports for the year. However, its Manufacturing and Services PMI reports showed positive growth instead. Manufacturing PMI recorded 53.6 points while its Services PMI was at 56.6 points. Australia also reported the same reports yesterday, July 23. Figures came in at 53.4 and 58.5 points, respectively. Unlike Britain, however, the country was already expected to post positive figures with its U-shaped recovery expectations for 2020. The deal breaker between the British pound and the Australian dollar was the UK retail sales report which posted an impressive 13.9% growth.