Good day traders! Check now the most recent charts and market updates for today’s session. Learn more about analysis and be updated on the current happenings in the market!
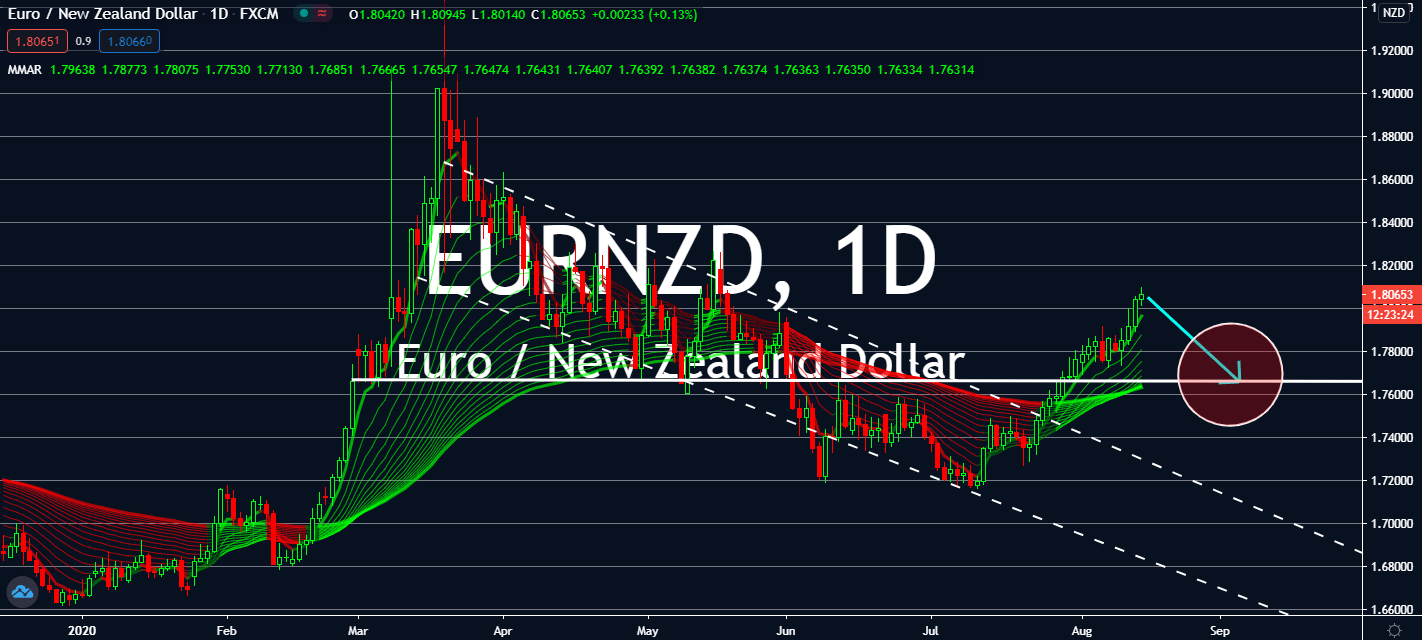
EURNZD
Even as some nations in the eurozone are already recovering from heightened cases of the coronavirus, the bloc is still bracing itself for a plunge in GDP in a quarterly and yearly comparison. The European Union had seen its economy suffer by more than 12% in three months ending March of this year, but markets expect it to see another increase of the same height. In 2019, it had seen a 15% decline, and investors expect the same fall this year. But it looks like its economy is just beginning to recover, considering the series of slow recovery records seen in the bloc this week. Namely, France’s monthly CPI for July was reported as expected at 0.4% against 0.1% from June, while its HICP remained at 0.4% for the same month. New Zealand’s extended two-week lockdown is expected to dampen the fall for the EURNZD exchange, although it’s at 80 percent of level three, as it shifts its gears to help dampen its costs.
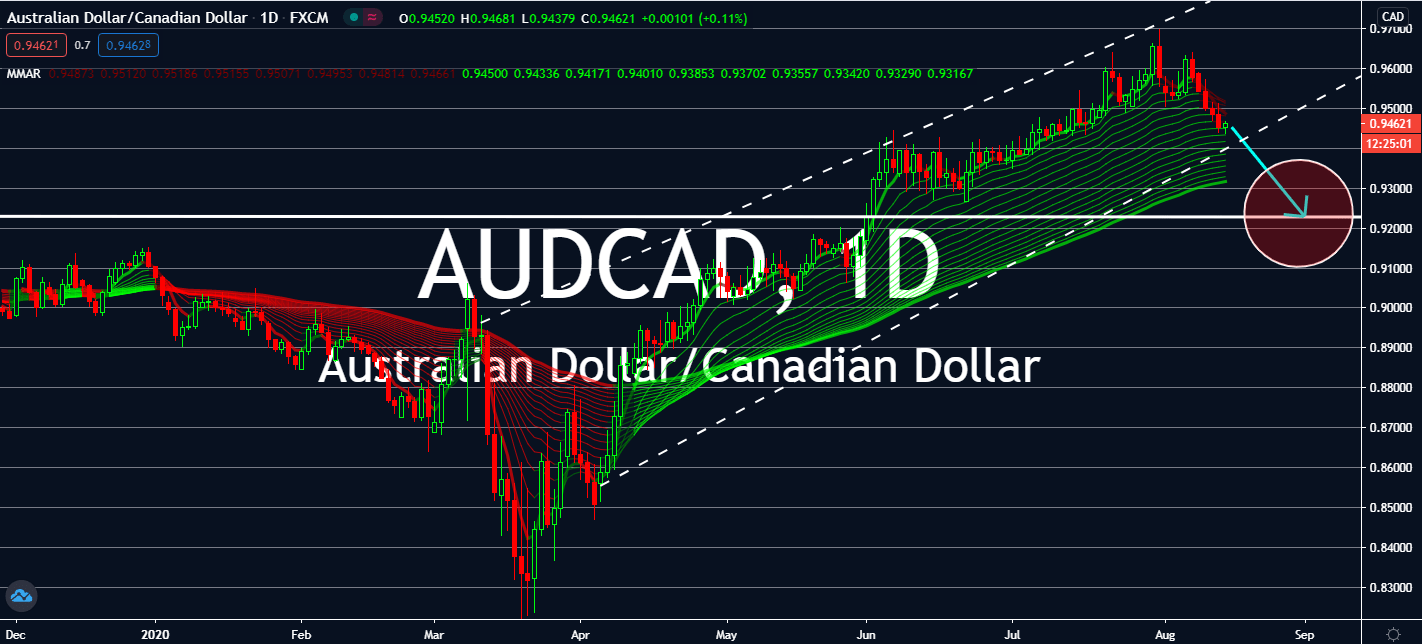
AUDCAD
Canada reopened after months of restrictions in large parts of its economy. Canada’s financial capital Ontario was recently lifted while most businesses have been permitted to resume their operations. Although businesses are projected to keep low in the near-term, especially for transportation services, its economy is still bound to see gains against its Australian counterpart. This comes with the country’s manufacturing sales expected to report an increase for the month of June against May from 10.7% to 16.4%. The figure has been rising since May, and if the figure will grow further for its report later today, it will help boost investments for the loonie even through further than in the next month. The AUDCAD pair is then projected to meet levels seen in the same months of last year, especially after the recent announcement from Australia’s central bank that its government should implement all levels of government fiscal stimulus to help its economy.
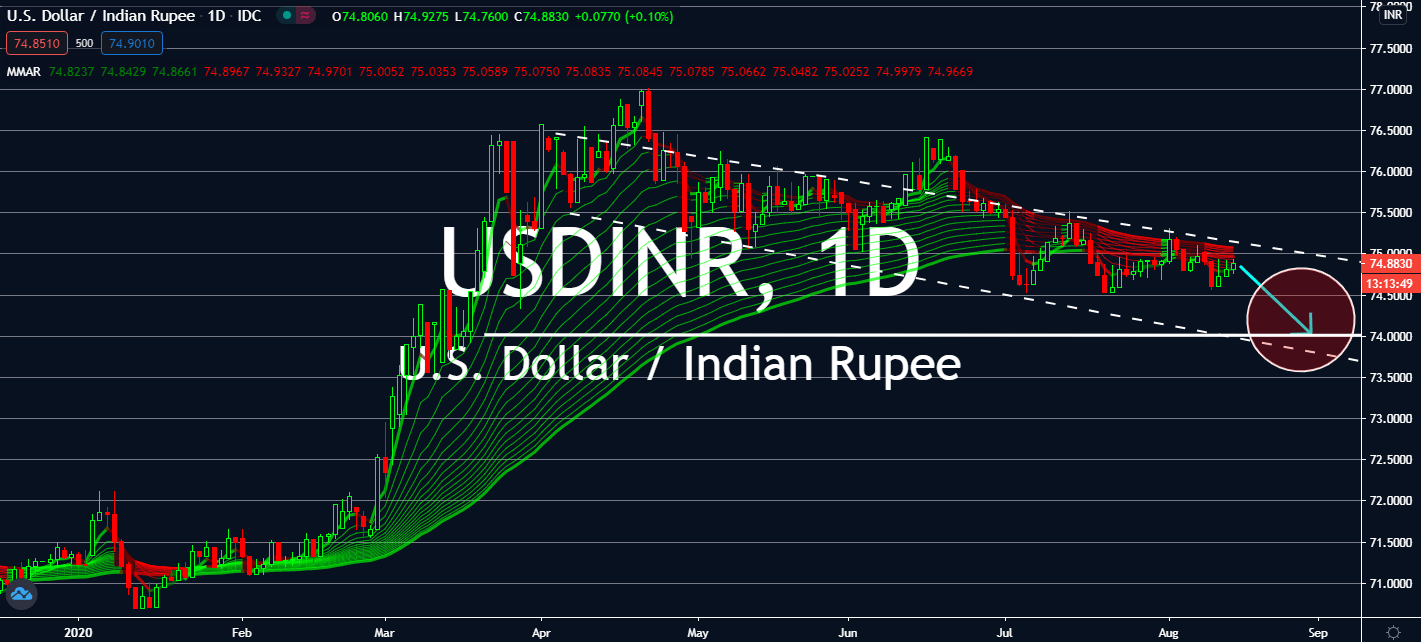
USDINR
Risk aversion is likely to subside in the upcoming sessions to force the USDINR exchange down with the bears. Core retail sales in the United States are bound to fall from 7.3% recorded in June to 1.3% for July, while industrial production is also projected to decrease from 5.4% to 3.0% on the same monthly record. Investors also expect the US to struggle with its fiscal stimuli. Retail sales are also expected to drop from 7.5 percent to 1.9 percent last month. Key economic data in India on the other hand were reportedly higher than expected for yearly comparisons. WPI Inflation in India boosted in the past year ending July from -1.81 percent in 2019 to -0.58 percent, which is also more than halfway up the market’s projection of -1.00%. WPI Food also doubled when compared to the same figure last year from 2.04% in July 2019 to 4.08% this year. Moreover, WPI fuel stepped up from -13.60% to -9.84%, also on a yearly basis for last month.
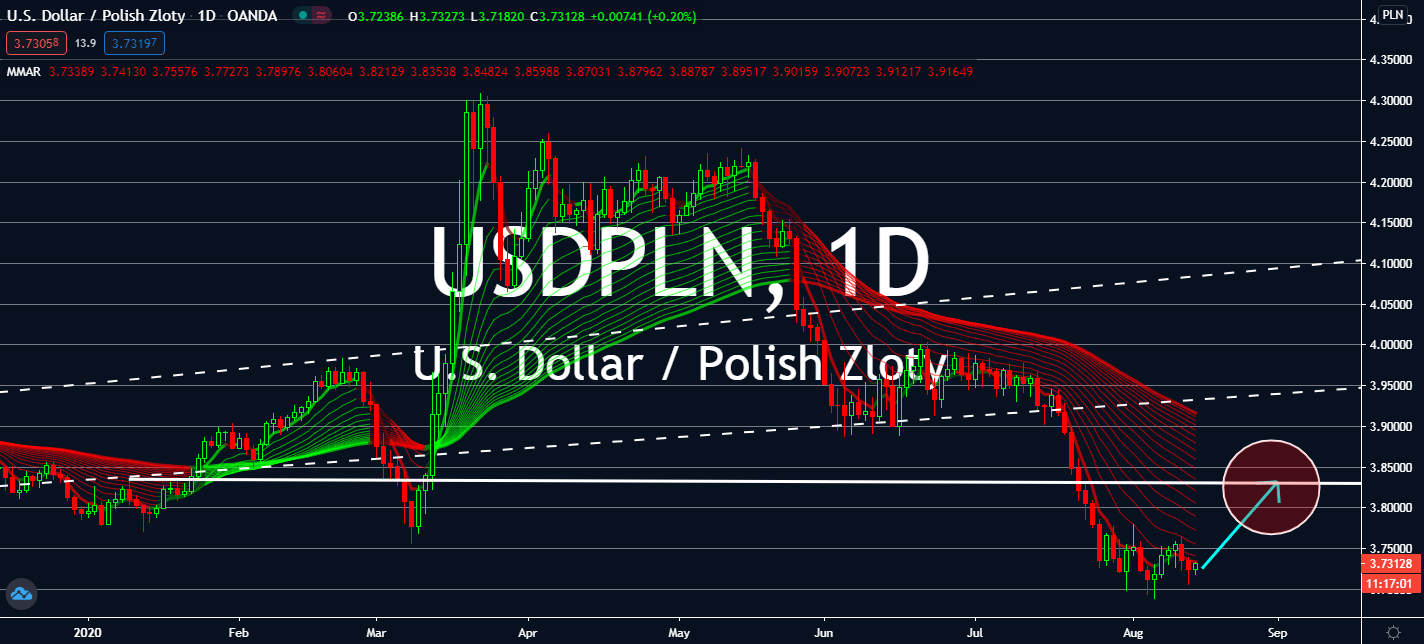
USDPLN
The Polish economy fell by -8.9 percent in a quarterly comparison in the second quarter of 2020. Although the figure was slightly higher from the anticipated -9.6 percent from Wall Street, it was still a massive fall from the first quarter, which recorded a 0.4 percent fall against the last three months of 2019. Yearly, it fell from 2.0% in the second quarter of 2019 to -8.2% this year, a little higher than the expected -8.6% fall. Meanwhile, the United States is taking an odd turn in the bonds market. The top economy’s core inflation jumped by its most in nearly 30 years with core CPI rising by 1.6% when compared to last year. This also shows the dollar’s technical appeal, since Poland’s own inflation rate declined in yearly, monthly, and estimated comparisons. Monthly, Polish CPI declined from 0.6% to -0.2%, below market estimates of -0.1%. Yearly, the same figure fell slightly from 3.3% to 3.0% against the anticipated 3.1 percent given prior.