Good day traders! Check now the most recent charts and market updates for today’s session. Learn more about analysis and be updated on the current happenings in the market!
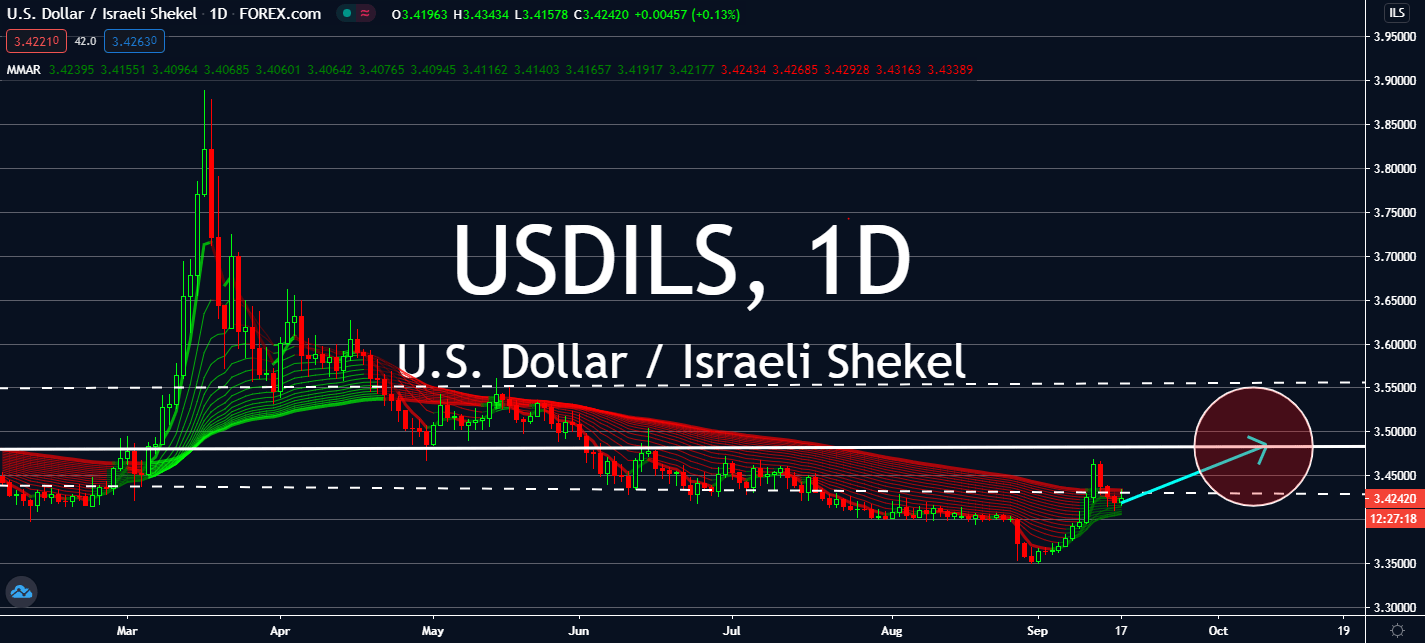
USDILS
The Federal Reserve’s announcements in yesterday’s trade session brought mixed reactions in the market. Although the greenback is projected to lower across most major currencies, it could meet better prices against the shekel near-term. This is because Israel announced an annualized slump that was even worse than investors expected. Market consensus called for a -28.7 percent annual contraction for the Israeli economy during the second quarter, but it reported a lower decrease to -29 percent instead. This could mean that its full-year contraction would be as much as 7 percent, its first in history. The worried market is projected to pull the dollar back to the pair’s previous support level near-term, which is also brought by several economic indicators that the US will be announced later today. Its initial jobless claims count, in particular, is expected to lower from 884 thousand last week to 850 thousand thanks to the Feds.
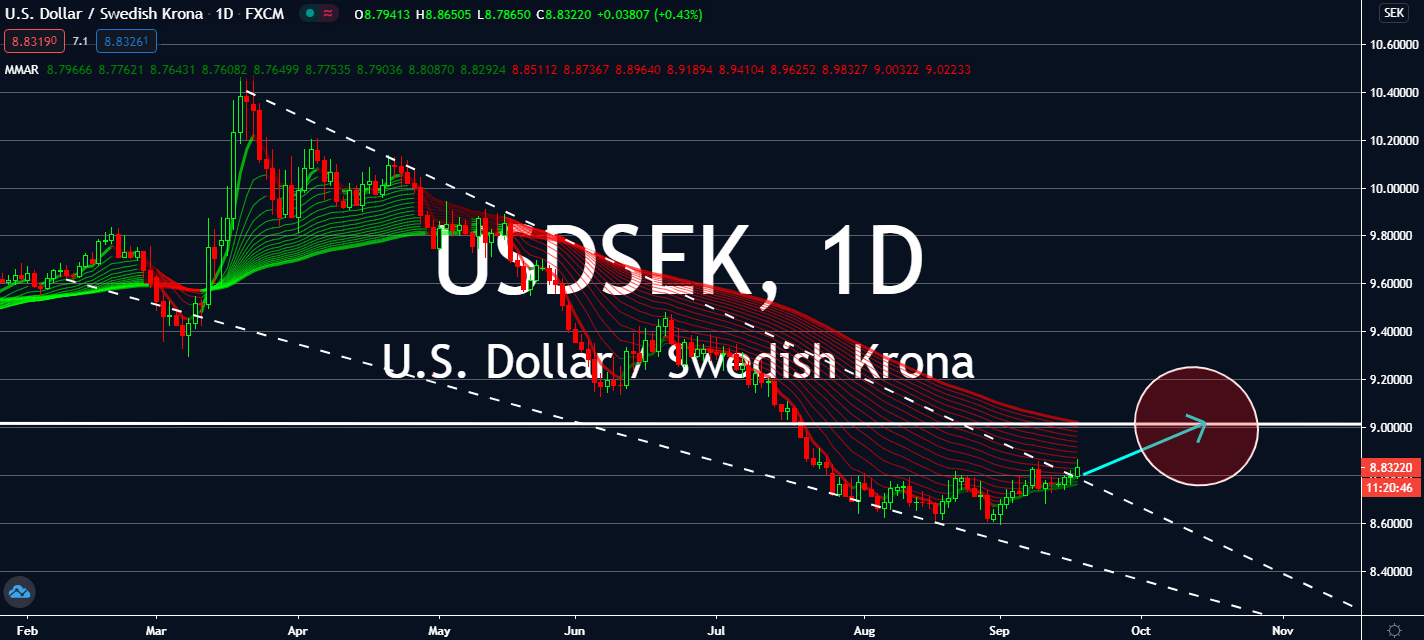
USDSEK
The Federal Reserve kept its benchmark interest rates unchanged at 0.25% and aims to keep it that way for the next two years or so. Several economic indicators in the US are projected to report a lift later today, such as a rise in building permits seen in the month of August from 1.483 million to around 1.520 million. The Fed’s focus on improving its inflation rate and employment records might finally see results this week from 884 thousand in the last report to 850 thousand in the current week. Sweden’s unemployment rate had also improved in August as per yesterday’s report. It came in at 8.8 percent, down from both the expected increase to 9.8 percent and the prior record of 8.9 percent in July. But coronavirus cases in Sweden are rapidly increasing – this could lead to an unprecedented lockdown in the near future and therefore a steeper economic decline as the US retains its 2 percent inflation expectation for the full year of 2020.
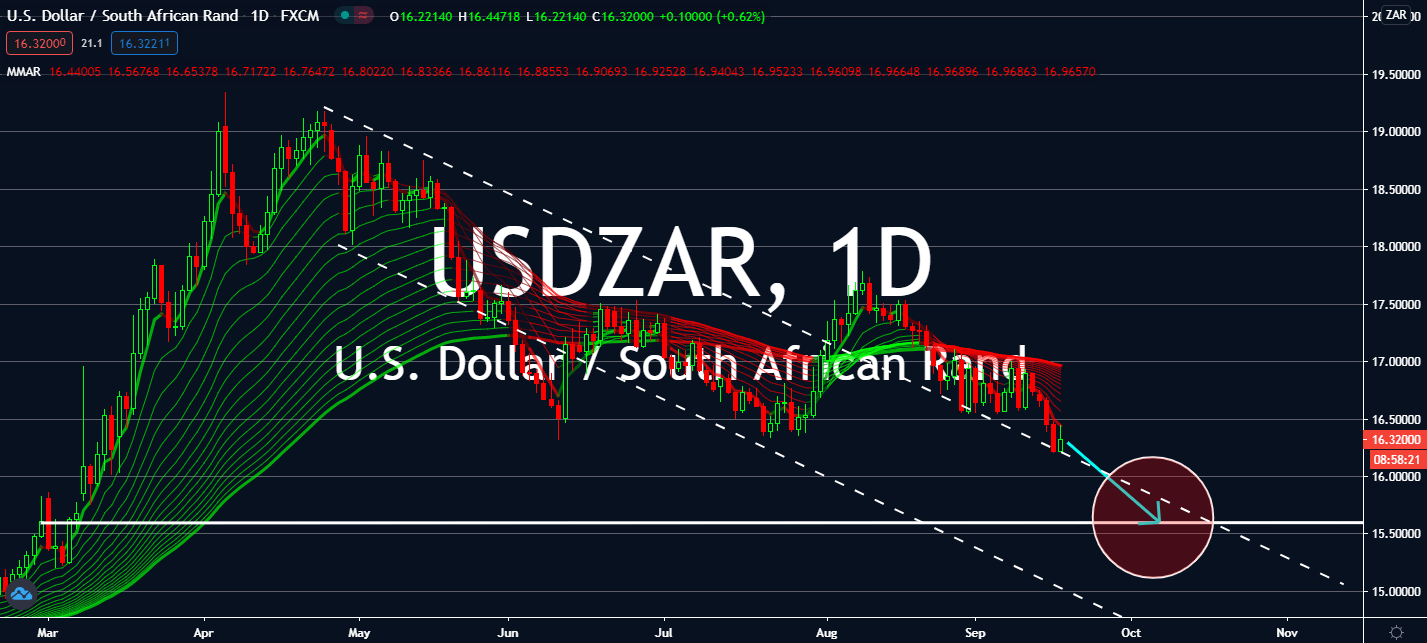
USDZAR
Starting September 20, South Africa will begin easing coronavirus lockdown measures, allowing public establishments to open their doors at 50% capacity, and alcohol will be sold once again. It turns out that the number of cases announced daily has dropped from 12,000 in July to less than 2,000. Its central bank is due for an announcement on its domestic interest rates today, which could determine the course of the country’s recovery from the fiscal slump brought by the coronavirus. Economists claim that the South African Reserve Bank will keep the rate at 3.50% with the new normal in place. Meanwhile, the United States is suffering from risk sentiment. The Federal Reserve kept its interest rate at the record low of 0.25% with an expectation to begin easing the rate only at least 2 years from now. Markets seem to be more hesitant to trade for the dollar as opposed to the rand near-term as they wait for more economic forecasts.
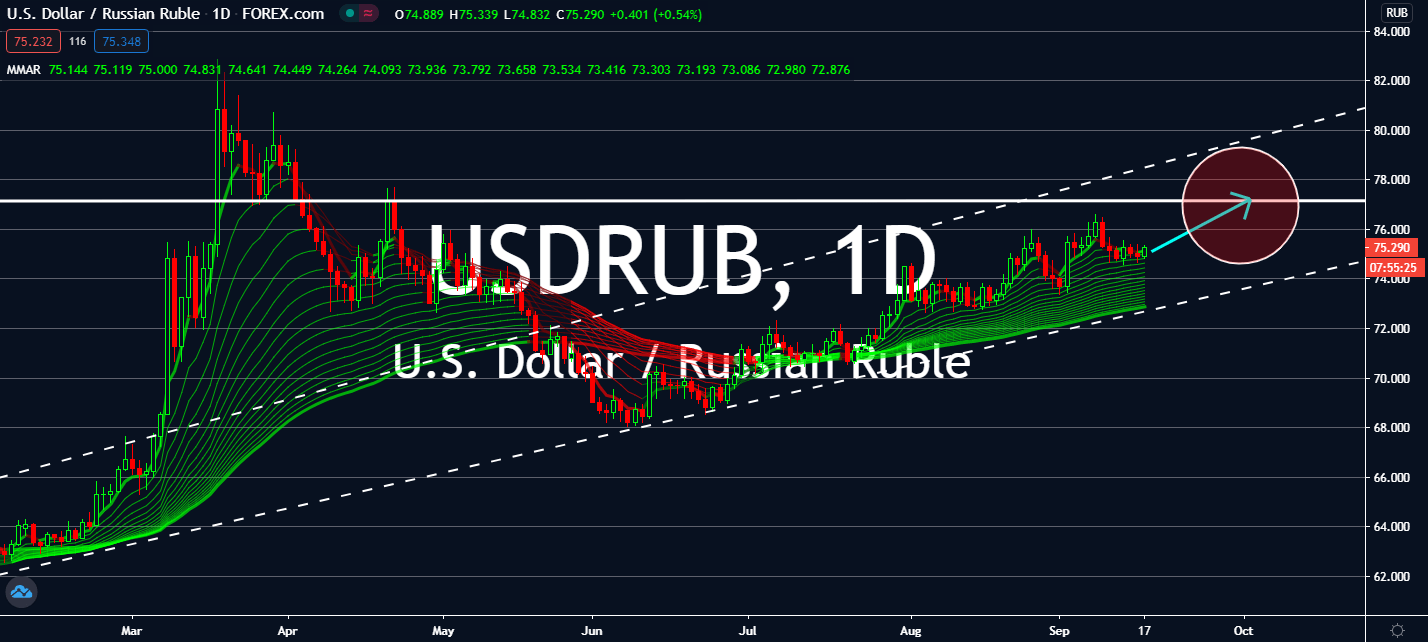
USDRUB
Thanks to mixed reactions for the Federal Open Market Committee’s meeting minutes yesterday, the greenback is projected to continue its track with the bears near-term. The uncertainty revolving around retaining its interest rate at 0.25% for at least two years came out well for most investors that believe it would help its economy recover from the coronavirus slump. The Fed’s inflation target remains at a maximum of 2% by the end of this year, which could start with lowering jobless claims and increasing retail sales figures within the next quarter. As Russia’s conflict with Germany continues, its currency counterpart is bound to keep the pair well in between its resistance and support levels for the foreseeable future. Moreover, markets are projected to skyrocket demand for crude oil inventories in the US after it saw an unprecedented supply cut brought by a hurricane. Investors should watch changes in oil and any changes in fiscal policies in the US.