Good day traders! Check now the most recent charts and market updates for today’s session. Learn more about analysis and be updated on the current happenings in the market!
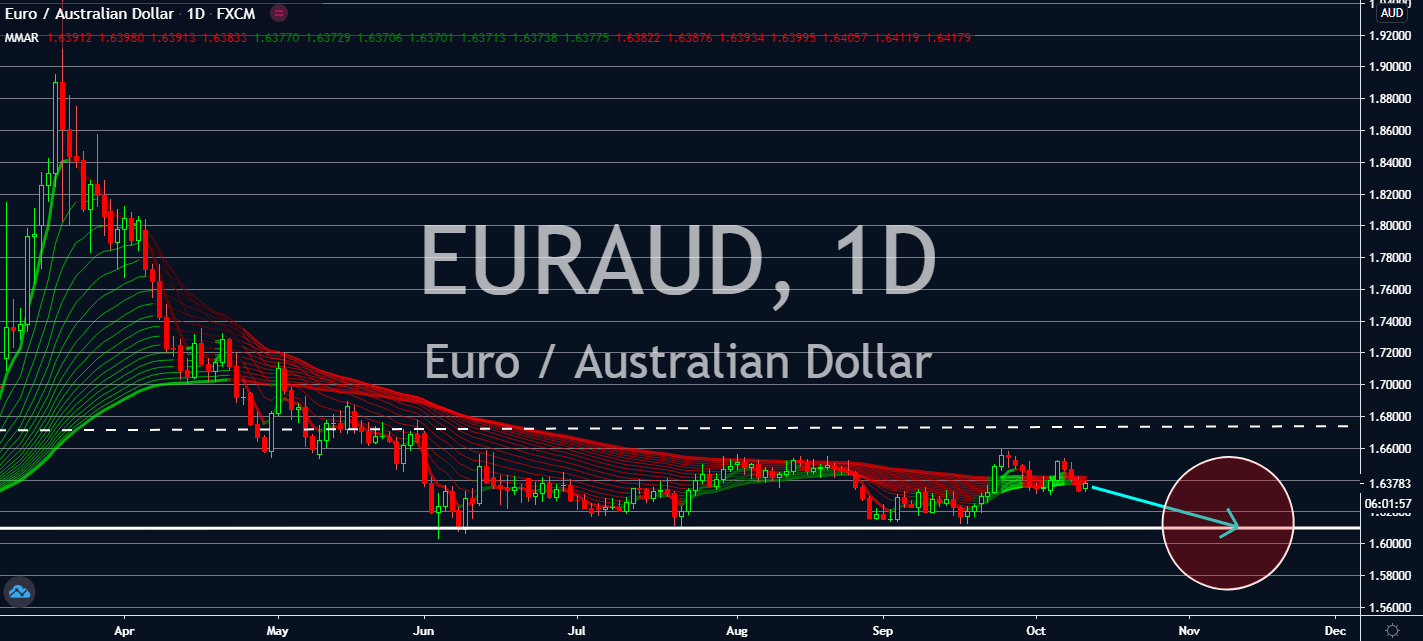
EURAUD
More and more economists are expecting investors to drop their confidence in key economies in the eurozone as coronavirus cases continue to uncontrollably spread in the bloc. Unemployment had risen for the fifth month in a row after ECB President Christine Lagarde confirmed that deflation will likely persist in the coming months. In the longer term, the central bank expects the figure to keep at 1.3% in 2022, which is far below its initial target, which had worried euro currency investors in the long term. It looks like this will be the eurozone’s biggest downfall against Australia, which recently eased its restrictions in its most populous state on Tuesday. As economic activity begins to increase in the region once again, the Aussie dollar is likely to boost until the eurozone reaches its last-minute agreement with the UK, or when progress takes place in the two-day EU summit to be held later this week.
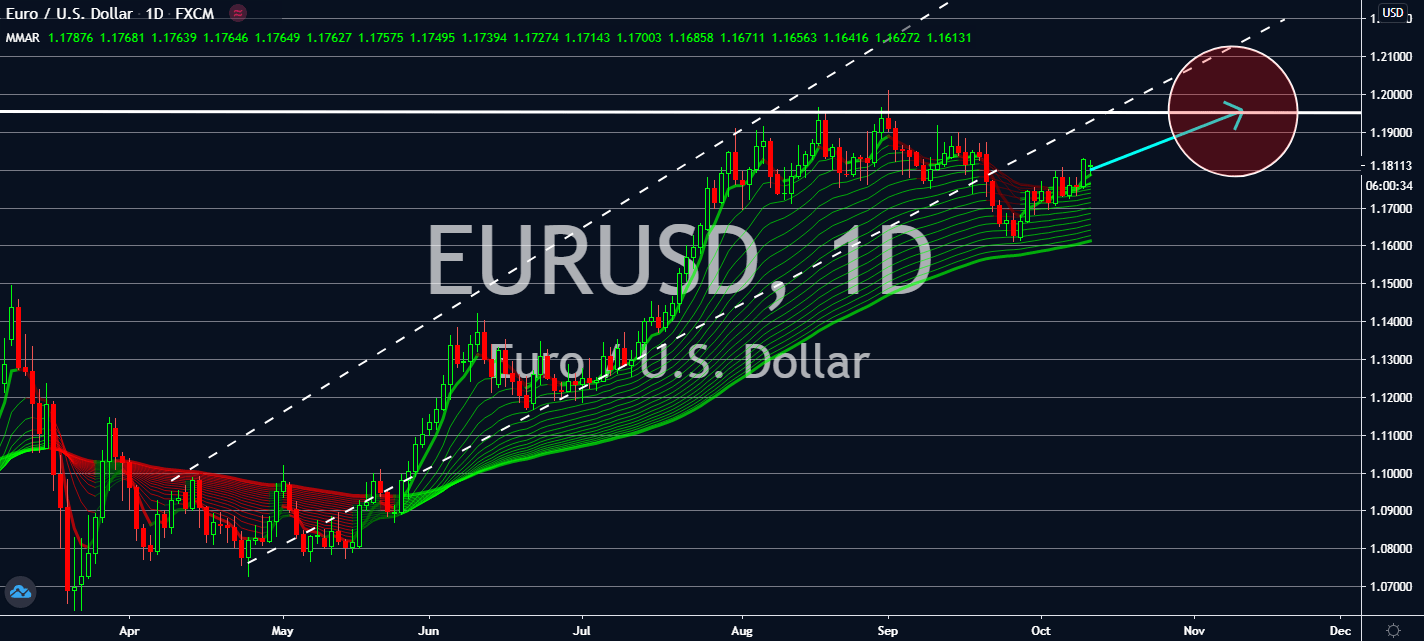
EURUSD
Several economic powerhouses in the European Union are likely to reach an agreement regarding their respective countries, including their coordinated efforts to curb economic losses from the resurging coronavirus pandemic and their approach to the Brexit trade agreement. Despite having a slow economy as of late, the eurozone’s progress is likely to benefit near-term because of this meeting. Both countries are going through a quiet day in its economic calendar today, so the pair’s trend will most likely depend on long-term swings for the US dollar, which could start only after the presidential elections on November 3rd. It looks like the optimism towards a new stimulus package in the US will likely benefit the dollar in the longer-term, instead. Unfortunately for the euro, this could simply mean that US dollar investors are preparing to pull the dollar down by next year and pull it down to levels last seen in late March.
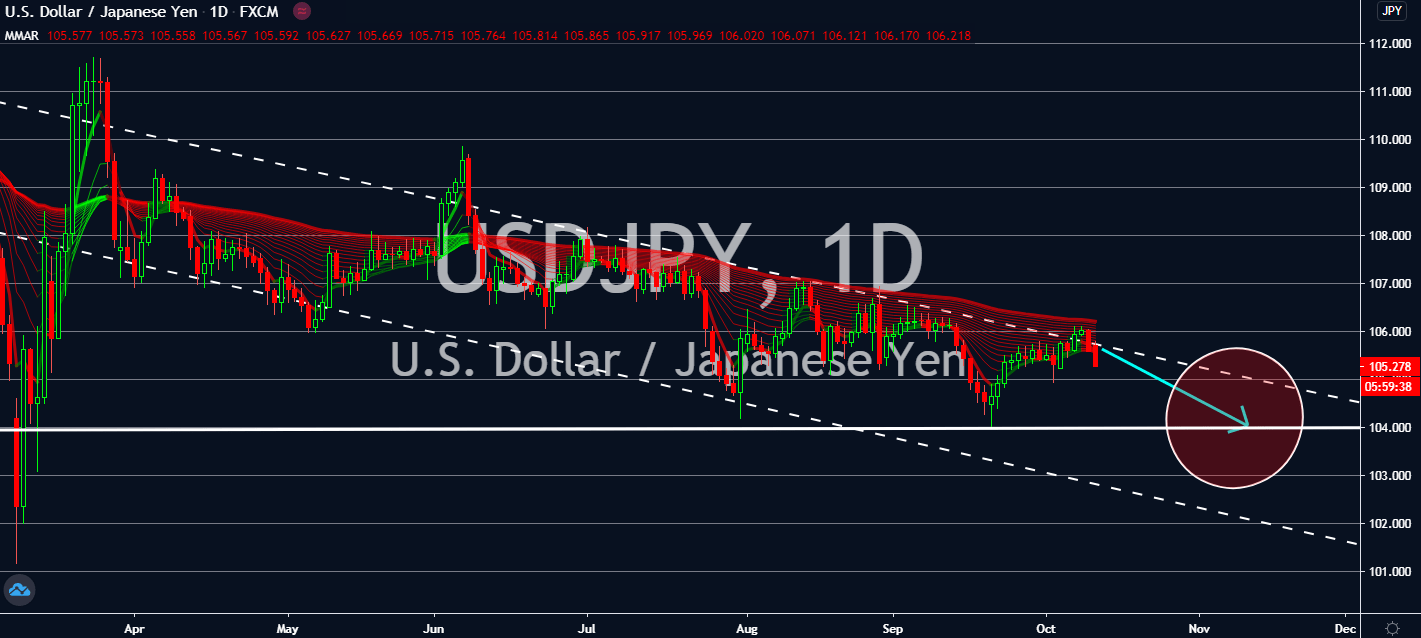
USDJPY
Japan reported that its Machinery Orders had declined by 15.2% on a yearly basis in August. Although this was seemingly pessimistic, it’s still better than what economists had expected – prior to the announcement, the figure was expected to have declined by 15.6% instead. Meanwhile, its monthly comparison was also better than expected from a 1% decline to a growth of 0.2%. It shows that amid economic growth in Japan, its businesses had begun to invest more activity. Producer Prices also decreased by 0.2% month-over-month in September despite a retention expectation, while the year-over-year figure fell by 0.8% instead of the estimated -0.5%. This relative increase is going to pull the pair lower near-term as the yen stands as a safe haven against the US dollar, considering the uncertainty around the US President Trump’s recent push-and-pull with stimulus packages that would help lift its economy less than a month before its presidential elections.
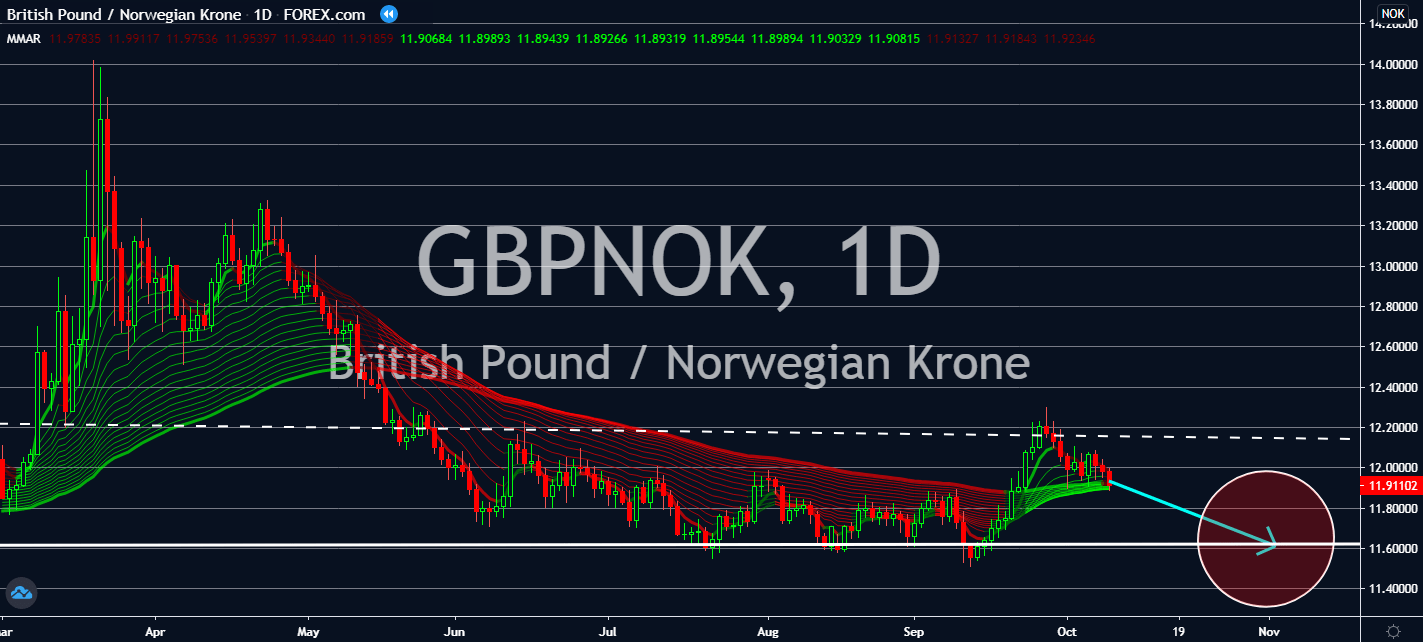
GBPNOK
Failing growth figures in the UK for August will continue to pull the UK currency down against its smaller peers, including the Norwegian krone. As oil wage protests begin to subside in Norway, the UK reported a decline in output in 2020 at 2.1%. It turns out that this was lower than the market’s estimates of 4.6% by more than a half. This was the fourth consecutive monthly decline after it had plummeted by 20% in April, showing its worst quarterly decline in history. Growth rates were also stronger in the three months prior, showing that August is only the beginning of a slowdown, prompted to bleed into the winter months. Hospitality activity rose by 70% on a monthly basis, but it looks like the overall activity had been too much to consider buying British pounds near-term. After all, restaurant bookings and travels have also stalled within the same month. Because of this, economists are no longer expecting a V-shaped recovery as they did prior.