Good day traders! Check now the most recent charts and market updates for today’s session. Learn more about analysis and be updated on the current happenings in the market!
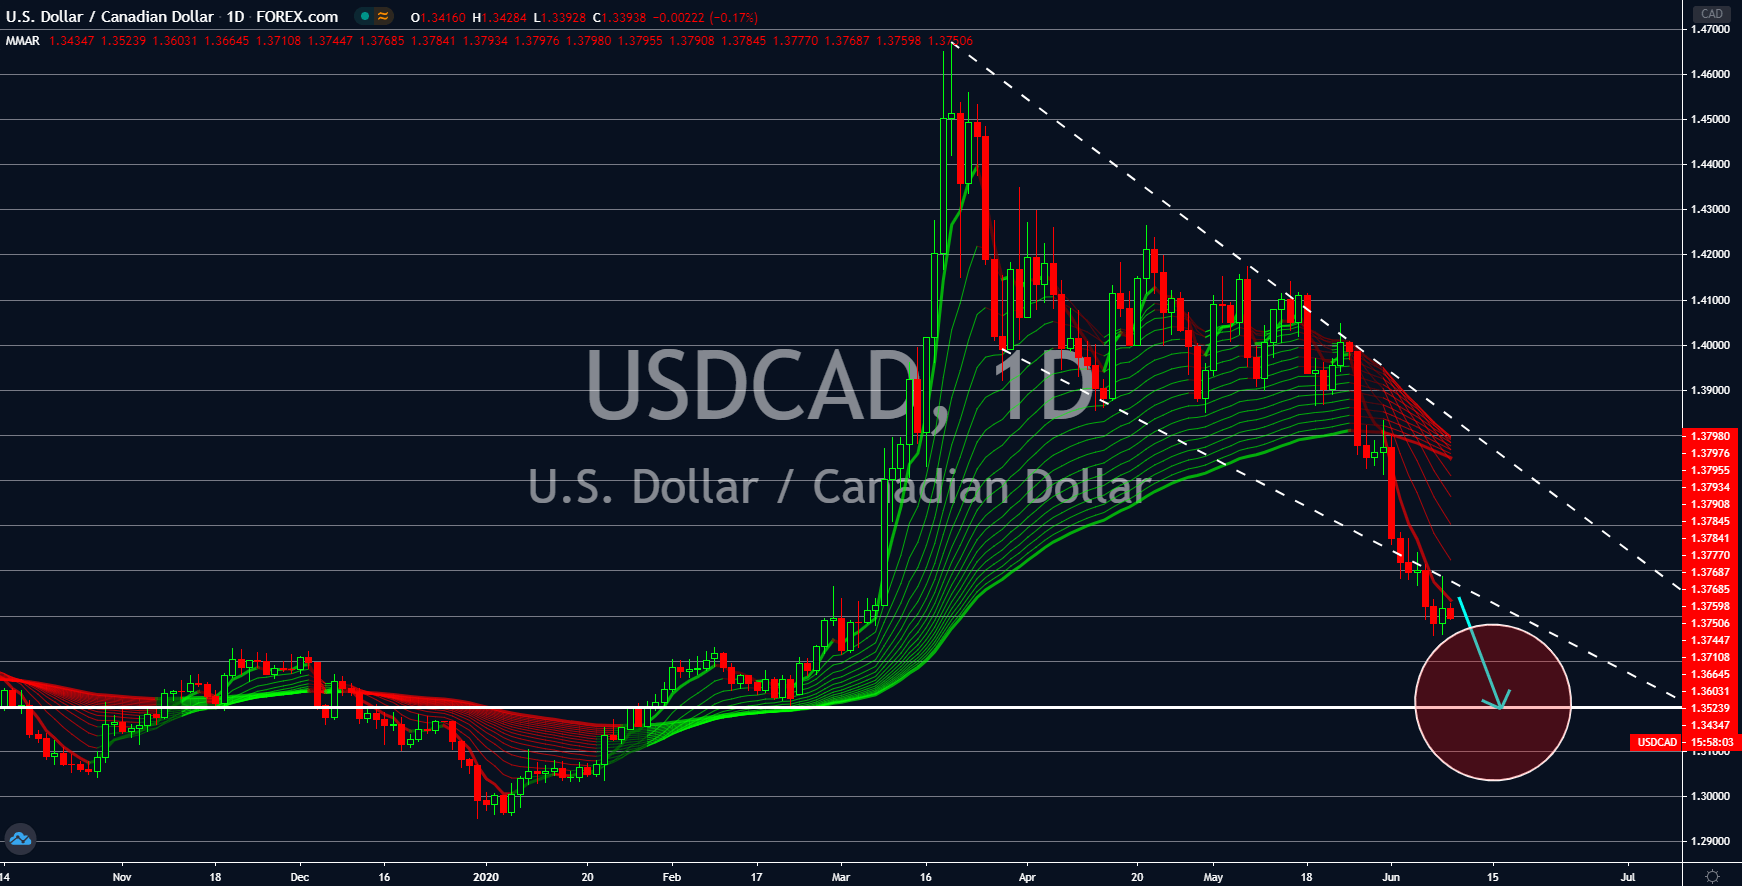
USDCAD
The US dollar has been in a free fall since the 26th of May against other currencies. The main catalyst for the decline of the greenback was the $6 trillion cumulative stimulus package. The economic aid was introduced by the US government and the Federal Reserve to keep the American economy afloat. However, as more USD circulates in the market, its value continues to diminish. Aside from that, the Federal Reserve has cut its interest rate to 0.25%. The central bank is also set to publish its interest rate decision today, putting Jerome Powell under pressure. If the US central bank cut another 25 basis points, this will send the interest rate at zero. The last time the Fed had this level of rate was during the 2008 Great Recession. On the other hand, investors were optimistic in the Canadian economy following the latest employment report. Canada added 290,000 jobs in May hinting the possibility of economic recovery in the country.
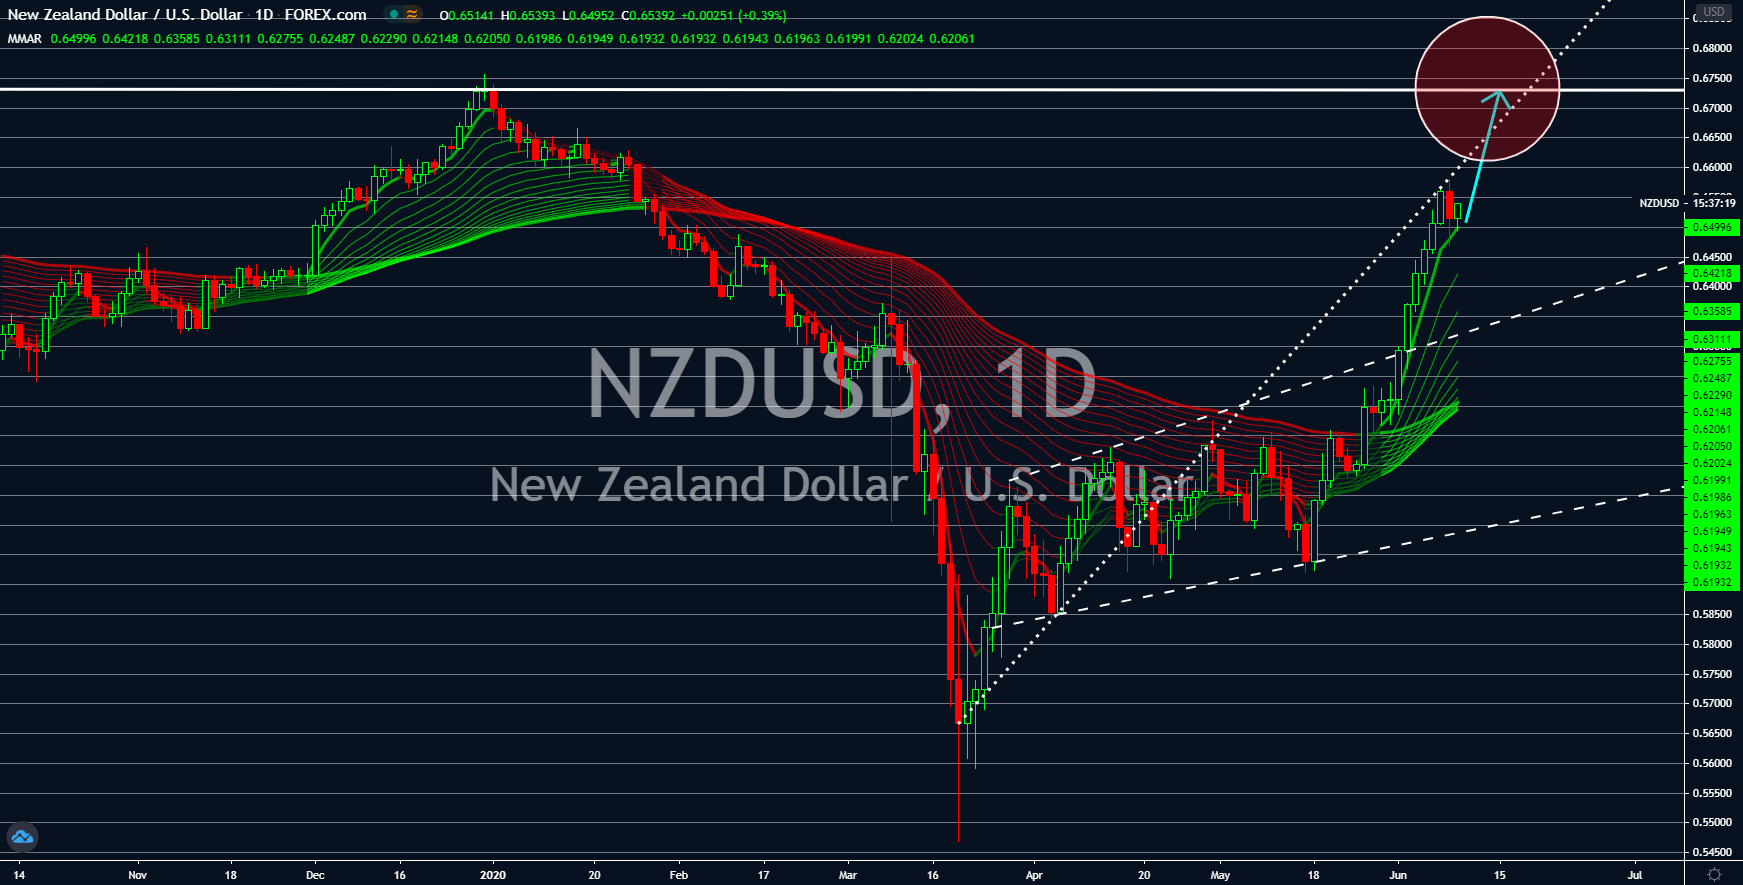
NZDUSD
New Zealand is celebrating the elimination of local transmission of the coronavirus pandemic in the country. NZ Prime Minister Jacinda Ardern announced on Monday that the country has no standing cases of COVID-19. In addition to this, she said that its people will be able to return to their normal lives without social distancing. This means that businesses will be able to open at their full capacity, prompting a robust economic recovery for Wellington. Despite this, the close border protocol by Ardern can still interrupt the V-shape recovery. Still, analysts are expecting a surge for the demand in the NZD in coming sessions. A rally is further expected with the NZDJPY pair as the greenback continues to lose its bullish momentum. The record-breaking stimulus package by the US government and its central bank is the main driver of weakness in the USD. The looming introduction of the fourth phase stimulus could further drag the greenback.
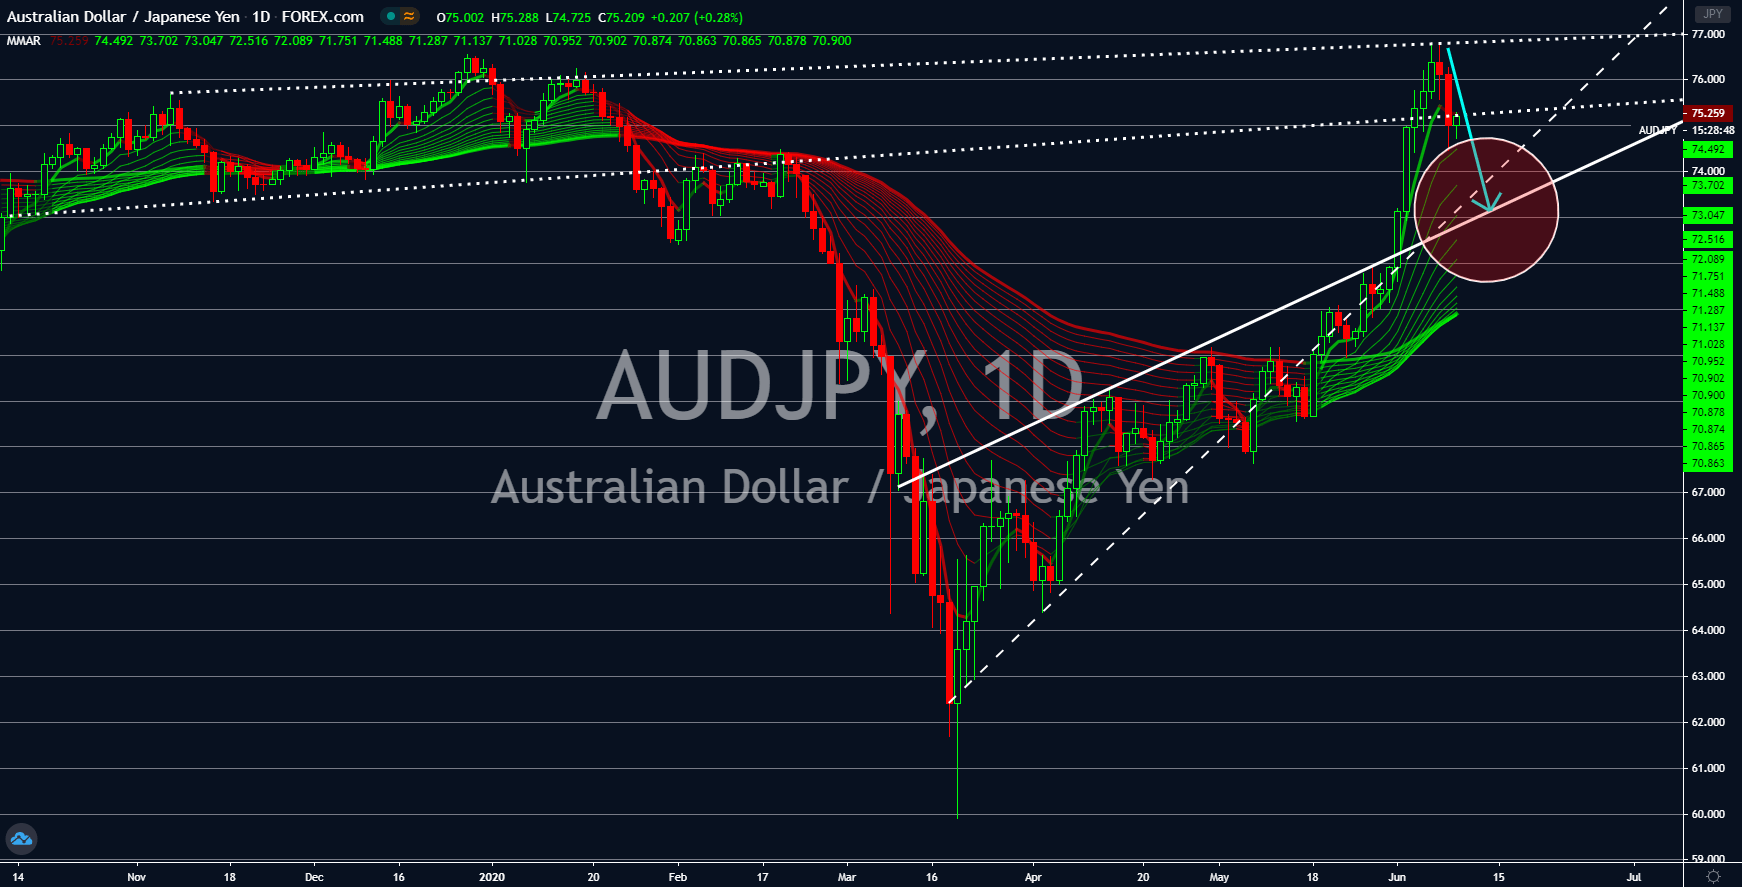
AUDJPY
The bullishness of the Australian dollar against the Japanese yen is about to come to an end. In May. Japan introduced its biggest fiscal stimulus to date at $1 trillion to help businesses recover from the coronavirus pandemic. Despite aiming to keep its economy afloat, the stimulus will negatively affect the yen as more currencies are in circulation. However, with the continuous decline of the American economy, investors are looking for safe-haven currency other than the US dollar. As Japan begins its economic recovery, investors are expected to flock on the yen. Another concern by investors on the US economy was its reignited tension with China. The US accused China of intentionally creating the coronavirus to use as a bioweapon. Moreover, the US has passed a bill seeking to end Chinese listing in the American stock exchanges. China retaliated by seizing control over Hong Kong. The US-China tension is creating uncertainty in the Australian economy.
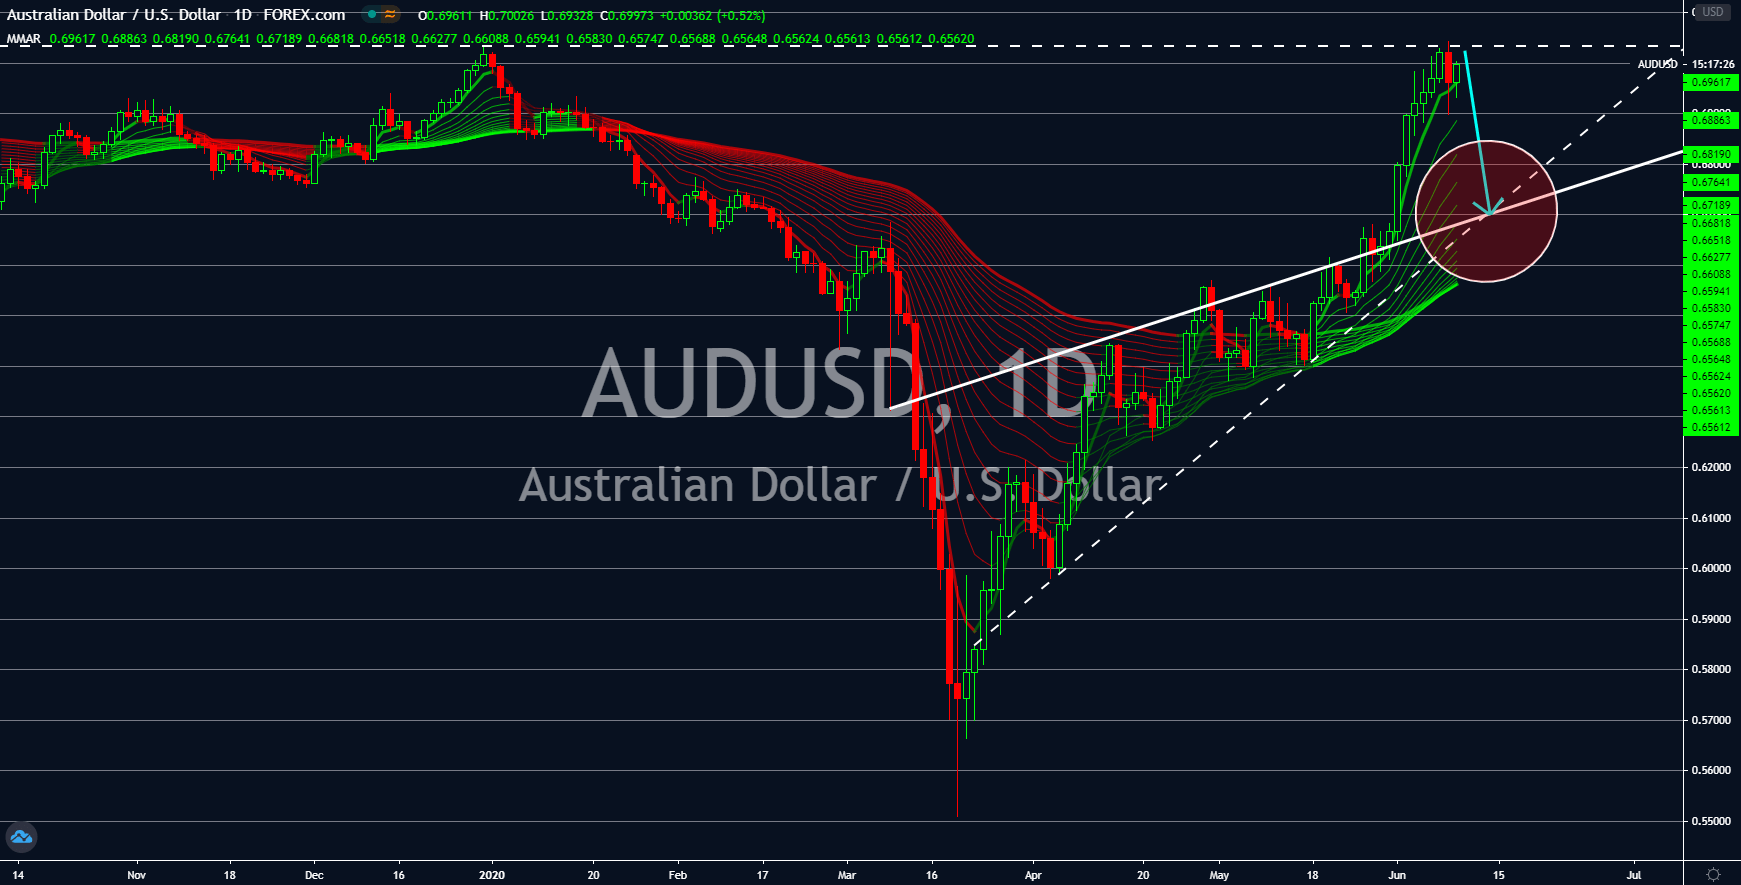
AUDUSD
The bears are back to haunt the Australian dollar in sessions. The renewed tension between the two (2) largest economies in the world are dragging the emerging markets. This is particularly troublesome for the Australian economy as it is just recovering from the coronavirus pandemic. Pessimism in the country was further fueled with the news that New Zealand was able to eliminate its COVID-19 cases. The tension between the United States and China began after the US accused China of orchestrating the virus to target its enemies. China dismissed this claim, but tensions were already high. China is trying to break the agreement it made with the United Kingdom during the 1997 handover of Hong Kong. It introduces a law that will end Hong Kong’s special administrative region (SAR) status. Australia is vulnerable to global crises as its economy is dependent on America and China, which are its biggest trading partners.