Figuring out chart patterns in the trading world can be challenging, especially for those new to the game. It’s like learning a new language where the market speaks through charts.
However, it’s an essential skill for any serious trader. By understanding chart patterns, traders can make more informed decisions, often leading to successful trades.
This guide will explore common chart patterns, decode their signals, and highlight key entry and exit points.
Whether navigating the bullish terrain of a double bottom or recognizing the ominous clouds of a head-and-shoulders pattern, this guide aims to simplify the intricate language of charts, empowering you to navigate the markets confidently.
Let’s dive in:
What Is a Chart Pattern in Trading?

At its core, a chart pattern is a series of visually identifiable price movements on a chart. These patterns are formed by the fluctuations in the prices of stocks, currencies, or commodities over time.
Technical analysts study these patterns to predict future market behaviour. The premise behind chart patterns is that history tends to repeat itself. Therefore, traders can anticipate what will happen next by recognizing these patterns as they form.
3 Major Chart Pattern Types
Navigating the financial markets landscape requires a keen understanding of chart patterns. Each serves as a unique language that communicates potential market movements. The three major categories—bilateral, continuation, and reversal—act as the foundation for deciphering these patterns and formulating effective trading strategies:
1. Bilateral Chart Patterns
Bilateral chart patterns are the cryptic messages of the trading world. They signal that the market could move in either direction, presenting a problem that requires traders to be prepared for multiple outcomes. Examples include symmetrical triangles and flags, where the convergence of trend lines doesn’t suggest a clear future direction.
2. Continuation Chart Patterns
Continuation patterns are like pauses in a conversation, where the market catches its breath before continuing in the original direction.
These patterns are vital for traders looking to ride the wave of a trend. Patterns such as flags, pennants, and rectangles indicate that the current trend is likely to persist, offering traders opportunities to join the trend with a higher probability of success.
3. Reversal Chart Patterns
Reversal patterns are the market’s saying, “I’ve changed my mind.” These patterns indicate a potential shift in market direction, offering traders early signals to exit or reverse their positions. The head-and-shoulders, double tops and bottoms, and cup-and-handle patterns are classic examples of patterns that signal a change in the prevailing trend.
Chart Pattern Cheat Sheet For Traders

Here are some of the most popular chart patterns:
Head and Shoulders (and Inverse Head and Shoulders)
This pattern is indicative of a reversal. The standard Head and Shoulders pattern signals a potential bearish turn after an uptrend, while the Inverse Head and Shoulders suggest a bullish reversal following a downtrend.
With their distinctive formations, these patterns play a crucial role in helping traders anticipate and respond to market reversals.
Double Top and Double Bottom
These patterns signal momentum shifts. A Double Top occurs after an uptrend, indicating a potential downside reversal. Conversely, a Double Bottom forms after a downtrend and signals a possible upward reversal.
Triangles (Ascending, Descending, and Symmetrical)
Triangle patterns are continuation patterns observed in trends. An Ascending Triangle is typically bullish, and forms during an uptrend; a Descending Triangle is generally bearish and appears during a downtrend. A Symmetrical Triangle can break out in either direction, indicating consolidation.
Flags and Pennants
Both short-term continuation patterns signify a brief consolidation before the previous trend resumes. Flags appear as small rectangles, usually sloping against the prior trend, while Pennants are small symmetrical triangles that form right after a sharp movement.
Cup and Handle
This pattern resembles a tea cup with a handle, indicating a bullish continuation. The cup represents a rounding bottom, and the handle is formed by a short pullback followed by a breakout above the handle’s resistance.
Wedges (Rising and Falling)
Wedges signal reversals or continuations depending on the trend context and the wedge type.
A Rising Wedge in an uptrend is typically bearish, while it can indicate a bullish reversal in a downtrend. A Falling Wedge generally suggests a bullish reversal in an uptrend and a continuation in a downtrend.
Rectangle (Trading Range)
The rectangle represents a consolidation phase in which the price moves between a well-defined support area and resistance before eventually breaking out. The direction of the breakout can indicate the continuation of the prior trend or a reversal.
Chartist Patterns As a Combination of Supports and Resistances

In the context of graphical analysis, we also discuss chart figures representing combinations of supports and resistances. These figures fall into two main categories: Reversal figures and Continuation figures.
Continuation Chart Patterns
Continuation chart patterns announce the continuation of the current trend. The exit from the figure is then done in the direction of the movement preceding the formation of the figure. In an uptrend, the figure indicates a continuation of the upward movement, and the opposite occurs in a downtrend: a continuation of the downward movement.
Continuation figures allow the asset to consolidate the current trend movement without calling it into question.
It is very common to observe these continuation chart patterns on price charts. Recognizing these patterns helps identify potential entry points and enables traders to take advantage of the trend, but caution is advised.
Whatever the extent of the consolidation within the figures, it is essential to wait for a signal of resumption of the trend before taking a position.
This signal can take the form of a reversal following a point of contact with one of the lines of the figure or even an exit from the continuation figure in the direction of the trend.
Other than previously, the bullish/bearish channel, the ascending/descending triangle, and the symmetrical peak/trough triangle are some of the most popular continuation chart patterns.
Reversal Chart Patterns
Just like the continuation chart patterns we saw previously, the reversal chart patterns indicate a reversal of the current trend.
The exit from a reversal figure is opposite to the movement preceding the formation on the chartist figure.
Thus, a reversal chart pattern announces an upward movement in a bearish trend. The opposite occurs within the framework of an upward trend: a figure announcing a bearish movement.
In graphical analysis, one should not anticipate the output of the figure. Indeed, a chartist reversal pattern is only validated when the price exits the pattern.
We discuss a breakout of the neckline or the bullish/bearish oblique. For example, we may see a double bottom appear on a chart, but this pattern can quickly transform into a triple bottom or range. It is, therefore, important to wait for the buy or sell signal.
Reversal patterns are very relevant, with ETEs and ETEi (inverted shoulder-head-shoulder) at the top of the list, as is the wedge.
These offer excellent probabilities of successful trades. Each chartist reversal figure has a theoretical objective of the course, and the latter is not always achieved.
Therefore, following the movement with a close stop at the figure’s exit is essential. This type of figure gives a counter-trend signal.
However, the most relevant figures generally go in the direction of the asset’s medium/long-term trend. A reversal pattern can be counter-trend in the short term, but only in the direction of the underlying trend.
If the type of pattern occurs in the direction of the trend, the pattern is then invalidated, and we have a continuation signal.
Bearish and Bullish Signals in Graphical Analysis in Trading
In graphical analysis, supports and resistances are identified, and prices’ behaviour as they approach and then contact these levels is analyzed.
The method usually used by traders is simple and based on visual graphical analysis. This consists of buying when prices come into contact with support and selling when they come with resistance.
On the other hand, in the context of a VAD (short sale), the method will then be reversed, so we will start by selling short in contact with resistance and buy back the position in contact with support.
Traders with much more experience use another, more or less complex approach.
This consists of waiting for a resistance to be crossed to buy and then hoping to benefit from continuing the upward price trend until the next resistance.
Likewise, during the breakdown of support, they will sell short in the hope of benefiting from a continued decline in prices until the next support.
Can Chart Patterns Cheat Sheets Replace Technical Analysis?
While chart pattern cheat sheets are incredibly useful, they are but one tool in the broader toolbox of technical analysis.
They provide a foundation for understanding market movements but cannot replace the depth and breadth of insights gained from comprehensive technical analysis.
Successful traders often combine chart pattern recognition with other technical indicators and fundamental analysis to make well-rounded trading decisions.
Conclusion

Using chart patterns and cheat sheets can significantly enhance a trader’s ability to make informed decisions. By understanding and recognizing these patterns, traders equip themselves with the knowledge to predict market movements more accurately.
However, it’s important to remember that no single tool guarantees success. The most successful traders use a combination of chart patterns, technical analysis, and fundamental analysis to guide their decisions. As you embark on or continue your trading journey, let chart patterns be your guide, but not your sole advisor.
Chart Patterns Cheat Sheet FAQ
Here are some of the frequently asked questions:
1. Are chart patterns reliable?
Chart patterns are reliable indicators of potential market movements but are not infallible. Their effectiveness increases when analyzed using analysis methods such as technical indicators and fundamental analysis.
2. Why do you need a chart pattern cheat sheet?
A chart pattern cheat sheet streamlines the pattern recognition process, enabling quick and informed trading decisions, especially in fast-paced trading environments.
3. What is the most profitable chart pattern?
Profitability can vary, but analysts often use patterns like the head and shoulders, cup and handle, and bullish or bearish flags for their predictive value and potential profitability.
4. Which chart to trade?
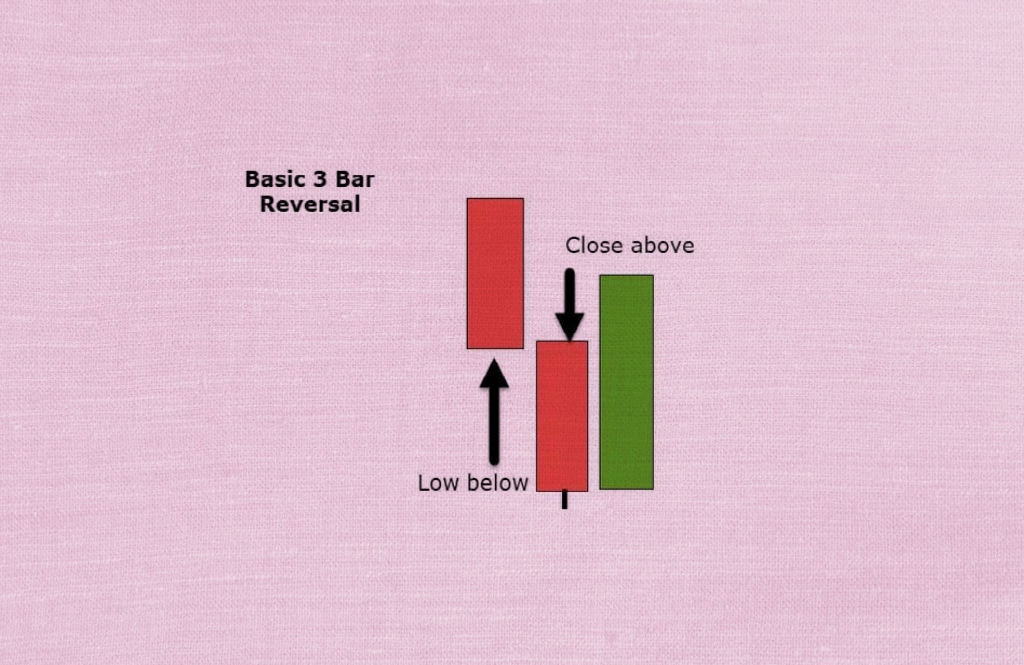
Japanese candlestick charts are widely used in trading. They provide a visual view of price fluctuations, showing opens, closes, highs, and lows over a period.
These charts help identify price trends and patterns important for decision-making. Traders can also use bar or line charts, but Japanese candlesticks are particularly popular for their wealth of information.
5. Which site to use for graphic analysis?
Several platforms are available for performing graphical analyses. Sites like TradingView, ProRealTime, and MetaTrader offer advanced chart analysis tools. These platforms allow traders to view interactive charts, apply technical indicators, and perform in-depth analyses. Choose a platform that meets your needs and offers customization features for accurate chart analysis.