Key Points:
- The USD/INR formed a Head and Shoulders pattern; key movements were noted at 83.54, 83.72, and 82.78.
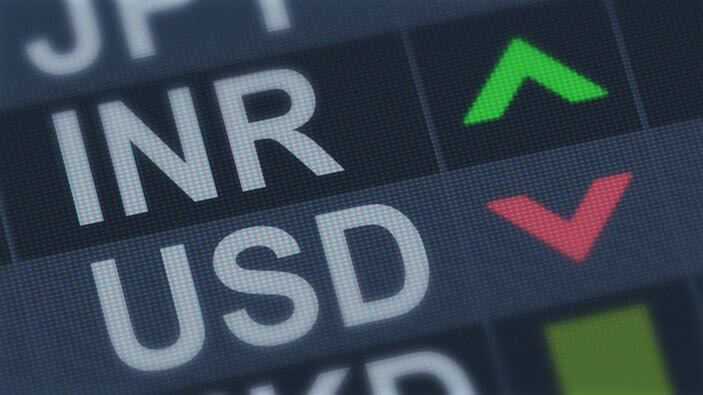
- The Indian Rupee traded positively despite a rebounding US Dollar, driven by strong domestic economic indicators.
On Friday, the Indian Rupee (INR) traded with a mild positive bias, even as the US Dollar (USD) rebounded. Investors focused on several key indicators, including the US Durable Goods Orders, the Michigan Consumer Sentiment Index, and a speech by Federal Reserve (Fed) official Waller. However, the looming uncertainty surrounding India’s upcoming election outcome could result in foreign outflows, potentially weighing the INR.
In May, the robust growth of India’s business sector supported the INR. The strong performance in exports and job additions has further bolstered the local currency. Additionally, a decline in crude oil prices has provided a favourable backdrop for the INR, given India’s status as one of the world’s largest oil importers and consumers.
USD/INR Hits 83.54, Signaling Potential Reversal
Significant movements in the USD/INR exchange rate have been observed recently. On March 21, the pair formed the Head and Shoulders pattern, a technical indicator often signalling a potential reversal. By May 13, the right shoulder of this pattern had formed at a level of 83.54. On April 17, the USD/INR pair reached a potential high point of 83.72; on January 15, observers noted a low point of 82.78.
Support and Resistance: USD/INR from 82.78 to 84.00
The USD/INR currency pair is testing several critical support and resistance levels. The key support levels include the 100-day Exponential Moving Average (EMA) and the neckline at 83.20, the psychological level of 83.00, and the January 15 low of 82.78. Resistance levels are noted at the right shoulder high of 83.54 and the April 17 high of 83.72, with potential further resistance en route to 84.00.
USD/INR Vulnerable Near 100-Day EMA at 83.20
From a technical standpoint, the USD/INR pair appears more vulnerable in the daily timeframe. The price hovers around the key 100-day EMA and the neckline. The 14-day Relative Strength Index (RSI) remains in bearish territory near 42.30. A confluence of the 100-day EMA and the neckline at 83.20 provides a critical support level. A decisive closing price below 83.20 could pave the way towards 83.00 and 82.78. Conversely, sustained buying above 83.54 might invalidate the Head and Shoulders pattern, potentially leading to further gains towards 83.72 and 84.00.
INR Bolstered in May by Exports, Jobs, and Oil Decline
In May, the strong growth in India’s business sector and sharp increases in exports and job additions supported the INR. Considering India’s significant oil import needs, the decline in crude oil prices also underpins the local currency. Meanwhile, stronger US economic data and hawkish remarks from Fed officials could bolster the USD, limiting downside risks for the USD/INR.