Key Points:
- Resistance Levels for USD/INR: Key resistance at 83.40, 83.54, 83.72, and the psychological level of 84.00.
- Support Levels for USD/INR: Key support at 83.20, 83.00, 82.78, and 82.65.
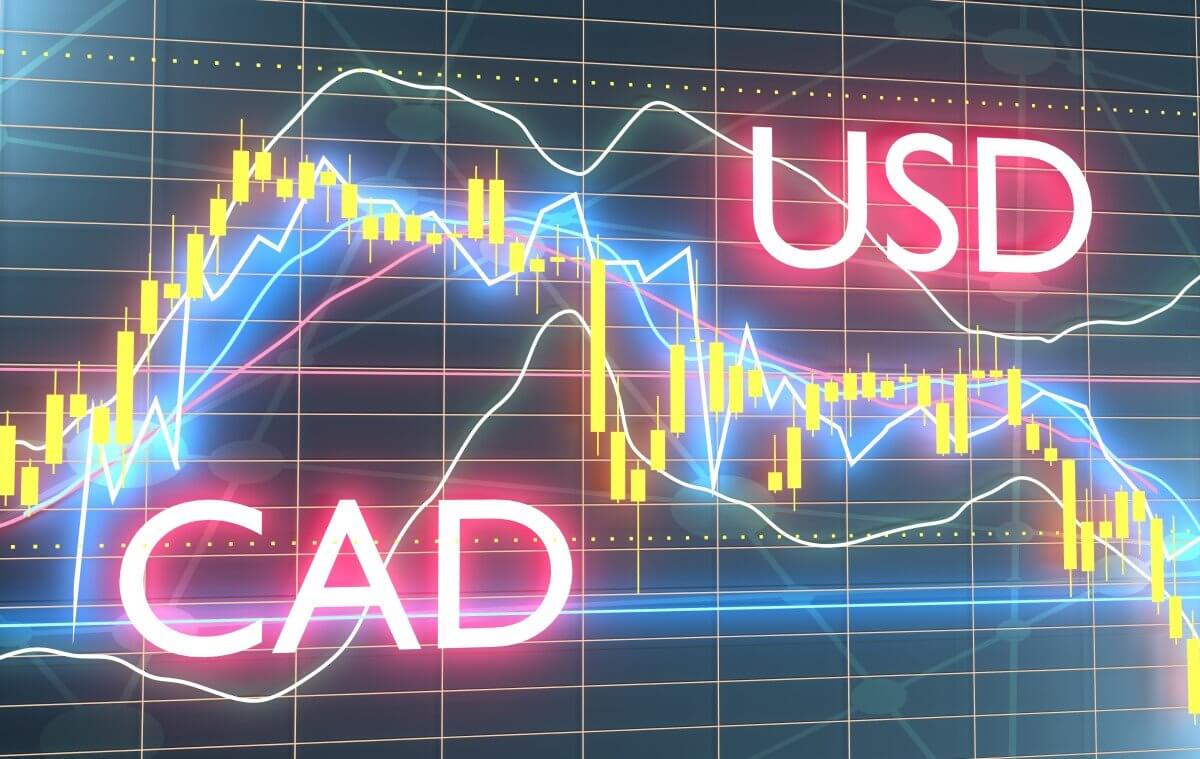
- Technical Analysis: USD/INR above 100-day EMA, RSI around 50; descending trend channel since mid-April.
The USD/INR pair has been displaying a bullish trend recently, although the exact current price is not specified. The pair is navigating through key technical levels that dictate its movement. Resistance is identified at several points, including 83.40, which marks the upper boundary of the descending trend channel, and 83.54, a notable high from May 13. Further resistance levels include 83.72, the high of April 17, and the psychological level of 84.00.
On the downside, support is seen at 83.20, aligning with the 100-day EMA, followed by the round mark 83.00. Additional support is found at 82.78, the low of January 15, and 82.65, the low of March 11.
April’s Core PCE Data: Anticipated USD/INR Volatility
A critical upcoming event that could influence the USD/INR pair is the April release of the US Core Personal Consumption Expenditures Price Index (Core PCE). This index is a key inflation measure that the Federal Reserve closely monitors. Changes in this index can signal shifts in monetary policy expectations, impacting the USD’s strength. Anticipating this data release will likely create market volatility as traders position themselves based on expected outcomes.
Fed’s High Interest Rates Affecting USD/INR Dynamics
The Indian Rupee has weakened amid a rebound in the US Dollar, driven by the Federal Reserve’s commitment to maintaining higher interest rates for an extended period. This “higher-for-longer” rate mantra has boosted the USD, increasing selling pressure on assets in emerging Asian markets, including the INR.
Additionally, cautious anticipation of key US inflation data has supported the USD further. Despite this, a decline in crude oil prices might limit the downside for the INR, providing some respite.
USD/INR Technicals: Support at 83.20, Neutral RSI at 50
From a technical perspective, the USD/INR pair maintains its position above the 100-day EMA, a critical support level. The 14-day Relative Strength Index (RSI) hovers around the 50-midline, indicating a neutral momentum.
Notably, the pair has been within a descending trend channel since mid-April, which frames the recent price action and provides context for the bullish reversal attempts observed.
India’s Q4 GDP Growth at 6.8% Bolsters INR Outlook
India’s economic momentum remains robust, as evidenced by a strong GDP growth rate of 6.8% in the January-March quarter (Q4 FY24). This resilience is noteworthy amidst global economic pressures and highlights the underlying strength of the Indian economy. Such growth figures provide a fundamental backdrop that could support the INR in the longer term despite current market dynamics favouring the USD.