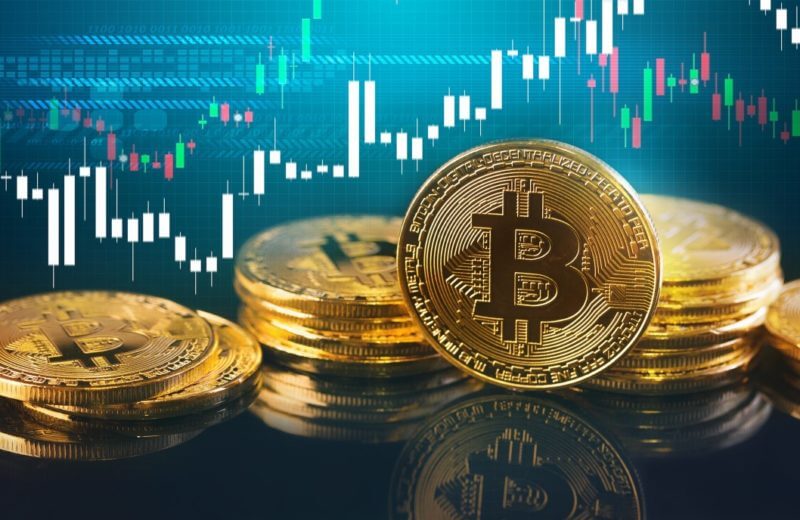
Key Points:
- XRP Price is at $0.5140, with recent highs of $0.5225 and lows of $0.4980.
- The 100-hourly SMA at $0.5100 shows stable trends amidst minor fluctuations.
XRP price is currently at $0.5140, reflecting a slightly volatile phase in the market. The cryptocurrency has recently reached a high of $0.5225 and a low of $0.4980. The 100-hourly simple moving average for XRP is $0.5100, indicating a generally stable trend over the past week. This moving average suggests consistency amidst minor fluctuations, providing a foundation for predicting potential movements in the near term.
XRP Price Hits $0.5225 High, $0.4980 Low Recently
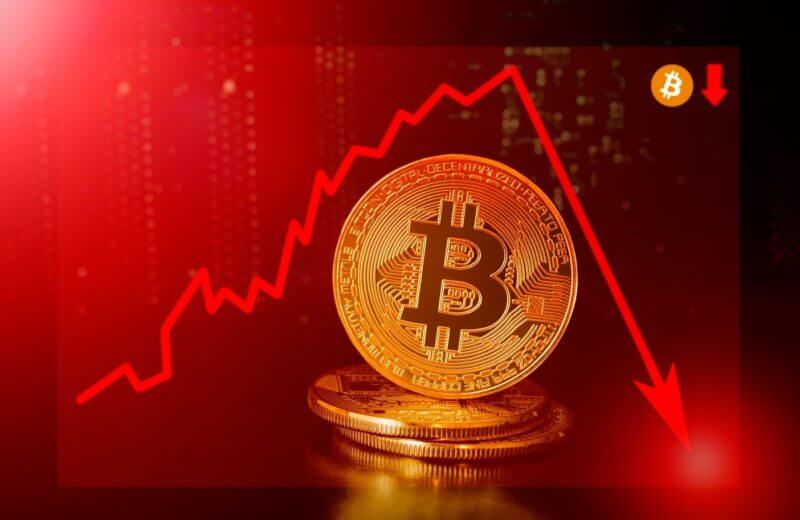
XRP has faced several resistance levels, notably at $0.5200 and $0.5195, with the next key resistance at $0.5220. It has tested levels such as $0.5180 on the support side, suggesting a robust foundation even as it experiences downside corrections. A critical technical marker includes the 23.6% Fibonacci retracement level of the upward wave from the $0.4980 swing low to the $0.5225 high. This retracement is a crucial indicator of potential reversal or continuation patterns, highlighting the cryptocurrency’s responsiveness to market dynamics.
XRP Faces $0.5200 and $0.5195 Resistance Levels
XRP’s immediate resistance is pegged at $0.5195 in the short term, closely followed by the key resistance level of $0.5200. This level is significant as it aligns with the short-term declining channel resistance. A successful breach of these resistance points could set the stage for further bullish momentum. Traders and analysts closely monitor these levels, as breaking through them could signal a strong upward trend, paving the way for XRP to reach new heights.
XRP Price Needs to Close Above $0.5200 for Bullish Trend
Should XRP close above the critical $0.5200 resistance, it may encounter the next key resistance at $0.5220. Overcoming these hurdles could propel the price towards targets of $0.5350 and potentially $0.5500. Such a movement would indicate a robust bullish trend, encouraging further investments and market confidence. The conditions for this upside include sustained trading above $0.5200, which would confirm the strength of the bullish sentiment and likely lead to increased market activity.
Critical Support for XRP: $0.5150 and $0.5120
Conversely, if XRP fails to clear the $0.5200 resistance, it could face an initial support level of $0.5150, with subsequent major support at $0.5120. The main support level is at $0.5100. This coincides with the 50% Fibonacci retracement. The calculation is based on the upward wave from the $0.4980 swing low to the $0.5225 high. Therefore, falling below these support levels could trigger a drop towards the previous low of $0.4980, indicating a potential bearish trend. Key indicators like the hourly MACD, which is gaining pace in the bullish zone, and the hourly RSI, which remains above the 50 level, suggest that while the market is presently inclined towards a bullish outlook, it is crucial to remain cautious of these support thresholds.