A lot of traders find the beginning stages of trading the most difficult and daunting to get through. There needs to be more guidance for some things, as many teaching outlets consider it common knowledge and thus not worth exploring. However, for someone that may not be tech-savvy or may just be brand-new, they can be difficult.
One of those things is using a trading platform for the first time. And by that, we don’t just mean buying and selling. On an intuitive level, most people will understand that you want to buy an asset and then sell it when its value increases. Likewise, they’ll get that the line on their screen represents the current price.
But what about the things beyond that? Experienced traders know that using a platform properly can significantly benefit your overall success. Today, our goal is to take you through some of the features you’ll see on most trading platforms and how to use them to your benefit.
Order/Asset Window
The order window is usually located in the top left of your screen, containing the assets available for trading. In most cases, you’ll be able to sort them on various criteria, including asset type.
However, you can also get useful asset information here. Right-click on the trading product you’re interested in, and you’ll be able to see more info. Depending on the broker, you may see the spread, price history, max leverage, opening and closing times, and more. Generally, it’s a great way to get some information quickly and without much research.
Take Profits, Stop Losses
Take profits and stop losses are among the most important trading features out there. They let you set a value for your asset to sell automatically when it reaches a certain threshold. In practice, it stops massive losses when asset value declines rapidly. It also collects wins before an asset declines, letting you step away from the platform.
As a beginner trader, we’d suggest setting these for every single trade you make. That way, you’ll avoid unnecessary monetary damage that may happen due to reckless trades.
Portfolio/History
Your portfolio and trading history will mostly be visible at the bottom of your screen. That way, you’ll quickly be able to view your current positions and results so far. We recommend using this to check for patterns or trading moves you repeat that don’t end well. You’ll also be able to check the assets you’ve sold to see how they moved afterwards.
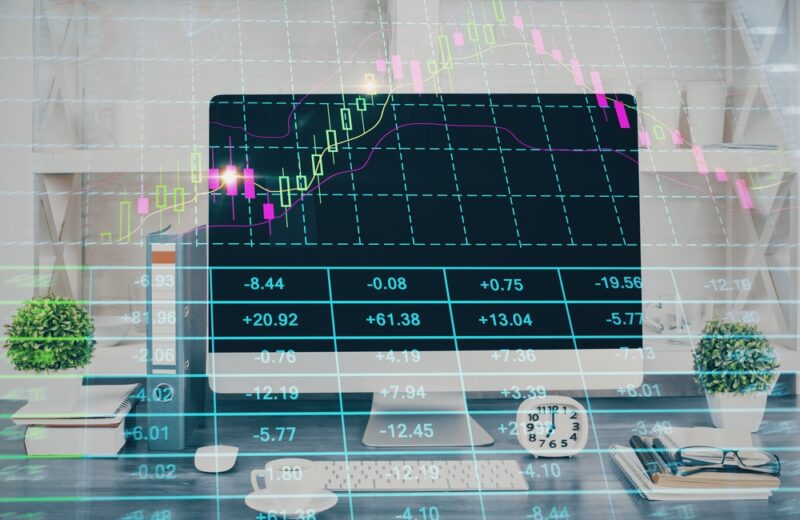
Charts and Time Frames
While line charts are the most intuitive, bar and candlestick charts can give you more information at a glance. Candlesticks, for example, show the open and close as a thick vertical line, while the minimum and maximum prices are thinner lines sticking out of the top and bottom.
And to a similar end, using timeframes is a fairly basic part of trading that isn’t immediately obvious. Usually, when you look at an asset, the default time frame is about an hour. That can make it seem deceptively turbulent, while zooming out can give you a more accurate vision.