Another big element of risk appears on the calendar tomorrow morning with the release of Non-farm Payrolls (NFP). Still, another factor has entered the equation as United States regional banks come under renewed pressure.
When this theme surfaced in March, it led to lesser US yields and a weaker US dollar accompanied by a rally in the EUR/USD pair toward the key resistance area around the 1.1000 level. While markets came under some pressure on the 9th and 10th of March, they rallied the following week as falling prices seemed to allay fears.
But yesterday, shortly after Jerome Powell expressed confidence in the banking system, banking risks resurfaced at PacWest. Of course, with that comes the fear of contagion; as behind-the-scenes hopes of bank convulsions are now dashed, the 2008-like conspiracy deepens as more and more banks come under pressure.
EUR/USD
EUR/USD is still very close to resistance, but at this point, the bulls have moved away from the previous week’s high.
A high was hit at 1.1096 in EUR/USD last week before prices returned to the 1.0943 Fibonacci level during Tuesday’s support test. However, following that support tests, the EUR/USD pair returned to their highs. They were on the verge of retesting last week’s high, losing just four pips in two consecutive attempts before and after yesterday’s FOMC interest rate decision.
GBP/USD
Next week the Bank of England rate decision will occur on Super Thursday. GBP/USD hit an 11-month high this morning after a tough reaction from the 1.2444 key level.
The weekly Bar is impressive, with just over a day to go. It is currently depicted as a doji dragonfly, but it also has the appearance of a hammer. Weekly low sits in a once-familiar resistance zone, the same 1.2444 level traded twice in December and January to set higher highs.
And we can see this area held above the 1.2500 level until last week’s break.
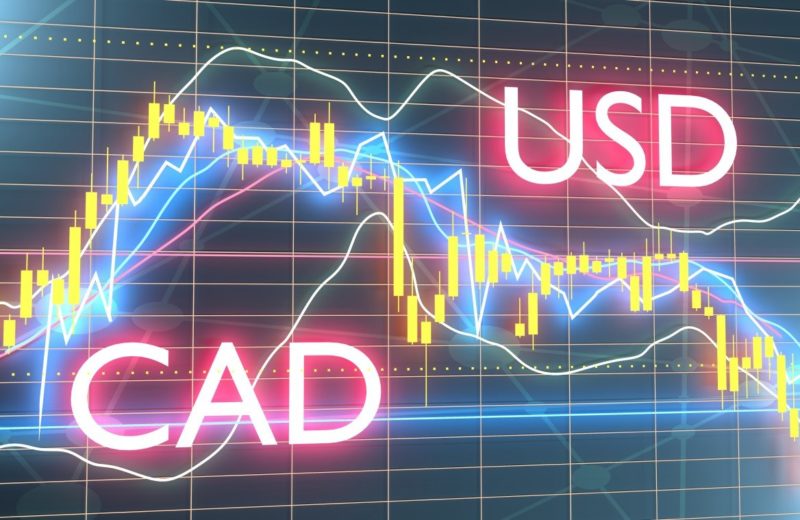
USD/CAD
USD/CAD saw an interesting uptrend in the second half of April that started to pull back before the May opening. As mentioned in these articles, the 1.3652 level was notable as the location of former support turned resistance over the last three days of the week. A drop from this level led to a bounce to a lower high, with the price staying below the 1.3652 price and a downtrend line connecting the March and late April swing highs.