
Today I will talk about the support and resistance levels, and chart pattern.
The first thing we need to do is to master the art of identifying support and resistance levels.
Imagine you are bouncing a ball inside your house. There are two barriers: the ceiling and floor. These two barriers will limit the fall and flight of the ball. There are similar barriers to trading. They restrict the movement of price action. Those barriers take on the names of support and resistance.
On an asset, such barriers in trading can have long-lasting effects. Because price action rarely forgets its past. Usually, traders are regarding a certain price level as entry or excellent entry points. Thus, it will most probably continue to act as a barrier of prices until all of their respective needs are satisfied.
Support
In this case, the buyers will naturally continue to buy at a specific price. Because the asset is undervalued until all of its demand fully absorbs the market. Thus, if buyers engage at Y price and the price is moving upwards only to return later, the very same buyers will defend their positions at Y. And then potentially add more to their current posts.
New buyers will see that price fell no further than Y before. Thus, they will most probably consider it as a safe entry. This step and concentration of buy pressure will prevent the price from falling any further. It will create a temporary floor known as support.
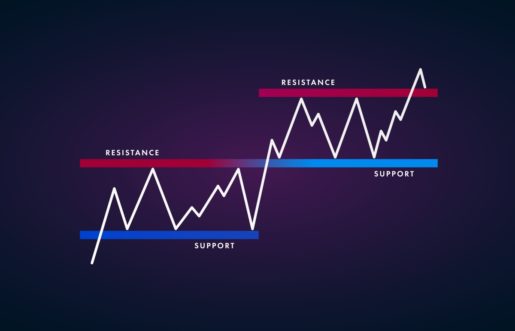
Resistance
This concentration of sell pressure forces the price level to act as a barrier, just like when there was high buy pressure. Just like when there was high buy pressure, here is the same situation. Except in this circumstance, it will act as a ceiling rather than a floor, known as resistance.
Horizontal Support and Resistance
The most comfortable and most important to identify support and resistance levels is when they take the shape of horizontal lines. Thus, a trend rejects repeatedly and at a very similar price point.
Directly connecting the dots between the peaks of trend or valleys creates the lines of the horizontal support or resistance.
Polarity
Those barriers do eventually break once either the buying or selling the market completely absorbs efforts. A significant shift in sentiment can take place when this occurs. This concept is polarity.
When behind an established resistance level, the selling level is fully absorbed, it is no longer an optimal point to take profit. Nevertheless, it is viewed as a good entry point for buyers. It is because of the disappearance of sell pressure, thus turning the resistance level into support.
In the case that buying pressure behind a support level is fully absorbed, it is turning to resistance level given traders are no longer interested in buying at that price.
It is regarded as a bearish development when the price breaks through significant support. Thus, an asset usually drops further until sellers reach a point of exhaustion. The subsequent rebound because of profit braining or taking hunting ends up creating a new support level.
Conversely, prices tend to follow the breakout until its next resistance level is identified, and surpassing resistance is bullish.
When coming in contact support or resistance lines, price trends are expected to take a breather. It is because of the concentration of selling and buying pressure that awaits. These levels might act as a barrier to price action for a lengthy period. Nevertheless, they don’t last forever as the market will eventually absorb their efforts.
All in all, resistance and support are helping to identify areas of strong demand and supply. To identify significant resistances and supports is perceived by many to be the most crucial aspect of trading.
Chart Pattern
All TA (technical analysts) are using the left side of the chart, attempting to predict the right side of the chart with a reasonable degree of certainty.
The business of technical analysts can become more of an art than a science with chart patterns. People who wrote robots, people, or science have been trading for decades in markets. Thus, the same chart patterns appear again and again on any tradable product.

Chart patterns and technical analysis are working very well with cryptocurrency. Because it is often difficult or impossible to evaluate fundamentals beyond essential network activity and use properly. A 24/7 market with no interruption or aftermarket hours is Crypto. Thus, it can make the chart patterns more evident because there is zero downtime while the pattern is forming.
Generally, each pattern has a known completion outcome and percentage. Thomas Bulkowski is the king of chart patterns. From 1991 to 2008, he chronicled almost 14,000 chart patterns on stocks. Those patterns closely align with Wyckoff’s market cycles. The markdown or markup phase often includes patters of continuation, whereas the distribution and accumulation phases often form reversal patterns.
The chart pattern is a recognizable fractal or formation that gives a bias towards future price movements. Generally, it’s easy to identify a stereotypical fractal structure that all chart patterns have. A poorly defined chart pattern shouldn’t be discounted entirely; nevertheless, thought of as having a reduced chance of the predicted outcome. Any repeating pattern on a price chart for an asset can be fractal. Fractals are not necessarily a classically appearing pattern. Harmonics and chart patterns are examples of these known repeating fractals.
Key to Successful Trade
There is a key to successfully trade these patterns. It is identifying them and forming a trading plan as the model takes shape. Every chart pattern has an essential aspect. Moreover, it is the most crucial aspect of new traders. It is a clear road map for entry, stop loss, and target of a trade. Therefore, the chart pattern setups are highly actionable trading signals.
Generally, all patterns trigger a short or long entry when diagonal or horizontal resistance and support is a broker. Thus, not always, but often it is accompanied by value confirmation. Early trade entries can usually go in the opposite direction. Nevertheless, there are plenty of excellent looking setups that never go anywhere. As soon as information allows, all patterns can be drawn and predicted. Until after the crucial has completed, trade entry should never occur. Price often returns to retest this level after the breakout if a horizontal entry misses. This concept is a throwback.
We see stop losses at a local low or high of the chart pattern. Meanwhile, with the use of the measured move in conjunction with a 1.618 fib extension, determine the targets. Both are based on the depth of design. To project down or up from the breakout point, all measured movements are usually the size of the pattern formation itself. Fix extensions, and calculated moves are painting a projected target. Nevertheless, that target might always over or undershoot depending on market conditions. More often than not, a goal is reached ideally either during a new consolidation period or on a wick.
Volume Consolidation Periods
By descending, volume consolidation periods are often accompanied. Sellers and buyers become less and less eager to enter a trade until the direction becomes clear. A chart pattern can gauge the uncertainty or sentiment of the market and provide a prediction for the next price move.
This information is enough for now. Before continuing, the reader must carefully analyze the support and resistance level issues and chart patterns.