If you have dived deep into technical analysis on the financial market you have probably already encountered terms such as three white soldiers pattern and three white soldier strategy. In this article, we will see what three white soldiers candlestick charts represent and what to do next once you spot three white soldiers patterns.
Description and definition: What are three white soldiers
The Japanese candlestick pattern ‘the three white soldiers ‘ is part of the family of candlesticks announcing an upward reversal. It is a bullish reversal pattern also popular as the bullish three white soldiers pattern. Indeed, this type of candle will allow us to predict an upward reversal of future movements. Depending on the cycle to be studied, whether it is a short-term or long-term analysis, it will be necessary to adapt its time scale to daily, weekly or monthly data.
This type of decision support method is also very suitable for traders wishing to intervene on cycles of 15 to 30 minutes, it is a technique widely used by day traders for short-term trading. Also, it should be noted that for a better interpretation, great importance should be given to the size of the bodies and shadows of the candles forming the candlestick pattern. For example, a candle with a relatively large body will indicate significant pressure. The pressures will be all the more marked as the shadows will be small. Indeed, it will be preferable when you observe large candlesticks with small shadows to stay in the movement and not in the opposite direction. On the three white soldiers screener green = increase, red = decrease. Finally, a movement must always be accompanied by significant transaction volumes.
This figure gives excellent input signals.
What is a Japanese candlestick the three white soldiers?
A Japanese candlestick is a popular charting technique used in technical analysis to analyze the price movements of financial assets such as stocks, currencies, and commodities. The candlestick chart displays the high, low, open, and closing prices of an asset over a specific period. Each candlestick represents a specific time frame and provides valuable information on the price action of the asset.
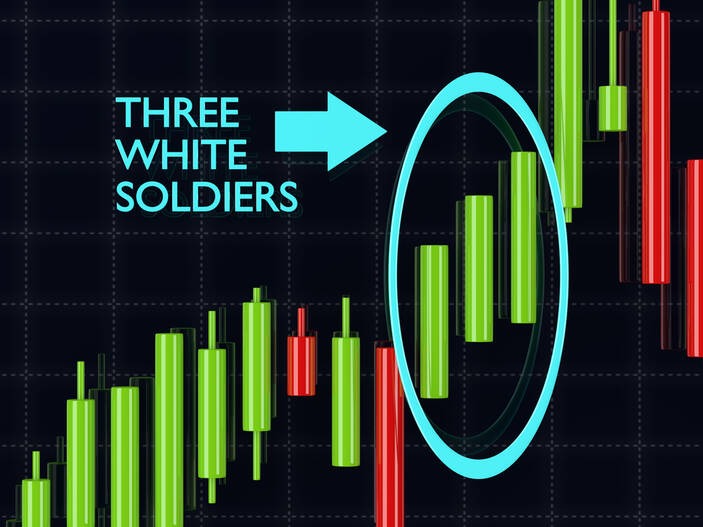
The Three White Soldiers is a bullish reversal pattern in Japanese candlestick charting that consists of three long white candlesticks with small or no wicks, and each candlestick opens higher than the previous day’s close. The pattern typically indicates a strong buying pressure in the market, where the bulls have taken control, and the price is likely to continue rising.
The Three White Soldiers pattern can be used to identify potential buying opportunities in the market. However, traders should always use other technical indicators and fundamental analysis to confirm their trading decisions and manage their risk.
This figure is materialized by the presence of three long green candlesticks which close consecutively at higher prices. They are characterized by a succession of three green candles with relatively large bodies and the weakest possible shadows. The first candle of these figures called the “candle of reversal” will validate all the more the figure if it belongs to an engulfing. The second candle must necessarily be larger than the first for the figure to remain valid. These conditions are not mandatory, but they reinforce their validity.
Characteristic of the candle the three white soldiers:
- Type: trend reversal
- Consequence: an increase in prices
- Pattern: in a downtrend
- Reliability: strong
- Number of Japanese candlesticks: 3
Psychology of a figure in Japanese Candlestick the three white soldiers
The three White Soldiers candlestick appears after a long downtrend and in a bear-controlled market. This type of figure generally appears when the market has been oversold, that is to say, that prices have remained at low levels for some time. Three white soldiers pattern also appears in troughs, when long-term lows have been reached. This very negative market sentiment will push some players to enter the market to do good business. This attempt to buy on the cheap will be decisive and will drive prices up with a long green candlestick succession. The bears are now forced to buy back their short positions, which will have the effect of driving prices up sharply. A trend reversal is then very likely.
It is a rising sign that indicates a reversal if it appears during a downtrend or a continuation of the rise if it appears during an uptrend.
How to interpret the three white soldiers candlesticks?
The “three white soldiers” is a bullish candlestick pattern that appears on a price chart. It indicates a strong reversal of a downtrend and the beginning of a new uptrend.
The pattern consists of three consecutive long white (or green) candlesticks, each with a higher closing price than the previous one. The open of each candlestick should be within the body of the previous candlestick, and there should be little to no wick or shadow on the upper part of each candlestick.
The three white soldiers pattern represents an increasing buying pressure in the market as investors become more optimistic about the future prospects of the asset. The pattern often occurs after a period of consolidation or a downtrend, and it signals a significant shift in sentiment.
Traders and investors may interpret the three white soldiers pattern as a strong bullish signal and may consider buying the asset at this point, expecting the uptrend to continue. However, it is important to use other technical indicators and perform proper analysis to confirm the pattern and make informed trading decisions.
How to use the volumes with the candlestick of the three white soldiers?
Volume is a critical component of technical analysis and can provide additional insight when combined with candlestick patterns such as the Three White Soldiers. Here are some ways to use volumes with the Three White Soldiers pattern:
- Confirming the pattern: High volume is a sign of strong market participation and can confirm the Three White Soldiers pattern. When the three candlesticks occur with increasing volume, it is a bullish sign that indicates a significant buying interest in the market.
- Comparing with the average volume: It is important to compare the volume during the Three White Soldiers pattern with the average volume for that asset. If the volume during the pattern is significantly higher than the average, it can indicate a higher level of conviction and increase the likelihood of a continued bullish move.
- Divergence in volume: If the volume is decreasing with each subsequent candlestick, it can indicate a divergence between price and volume. This may suggest that the upward momentum is weakening, and traders may want to be cautious.
- Using volume indicators: Traders can also use volume indicators such as the On Balance Volume (OBV) or the Volume Weighted Average Price (VWAP) to identify significant changes in the buying or selling pressure in the market, which can provide additional confirmation of the Three White Soldiers pattern.
It’s important to note that while volume can provide valuable information, it should not be used in isolation. Traders should always use other technical indicators and fundamental analysis to confirm their trading decisions and manage their risk.
Graphic representation of the three white soldiers candlestick
Depending on the representations used, a candlestick in a bull market will be represented with a white or green body, this type of candlestick is also called the yang candlestick (yo-sen).
Conversely, in a bear market, a Japanese candlestick will be represented by a black or red body. This type of candlestick is called the ying (in-sen) candlestick.
Three white soldiers strategy
1. Identifying the three white soldiers pattern
This is quite simple. The pattern is made up of three consecutive long-bodied bullish candlesticks with either short wicks or no wicks.
Each candlestick opens at a level lower than the close of the previous candlestick and closes at a level above the high of the previous candlestick. If the body of the first bullish candlestick in the pattern is above the low of the previous bearish candlestick, this makes the resulting three white soldiers pattern an even stronger bullish signal.
Once you spot this formation, this is your Three White Soldiers blueprint. This brings us to the next step.
2. Confirmation of the signal with the moving average of convergence and divergence (MACD)
Have you spotted your three white soldiers? Then it may not be enough. You need to go further and verify that the formation will really yield to your expectation of a price increase.
This verification will be done by using the MACD indicator. At this stage, try to ensure that your anticipation of a further rise in price is in sync with the MACD.
That one or more of the following MACD conditions should meet in order to be sure of a continued rise in price as predicted by the three white soldiers.
Crossing of the fast MACD moving average over the slow MACD moving average from bottom to top.
The MACD histogram shows increasing readings suggesting increasing price momentum.
The fast and slow MACD moving averages cross the zero line from bottom to top.
Both MACD moving averages reach the oversold level and reverse upwards.
3. Entering a Buy Position
Did one or more of the above MACD conditions meet? If yes, then you can enter your buy position. If none occurs, you’d rather not go long. It could be just a pullback as the main downtrend resumes soon after.
4. Adjust your Stop Loss
Put your Stop Loss just below the low of the first candlestick of the pattern. If you are trading without Stop Loss orders, you would rather stop and start using Stop Loss orders. The stop-loss order can save you a lot on a bad day when almost all trade goes south.
5. Adjust your Take Profit
What you are doing is identifying a major resistance level where most price moves tend not to break. It may seem so relative. But identify the nearest major resistance area in order to estimate the minimum amount of profit you can take. The price doesn’t limit to this level you choose and can always go beyond it, which of course translates into more profits.
The Three White Soldiers Pattern: What You Also Need to Know
In the beginning, we mentioned that the three white soldiers pattern is a bullish reversal pattern. As we progressed, it became apparent that using the candlestick pattern alone might not be enough. In fact, candlestick patterns alone cannot be enough to make trading decisions, just like a single indicator is not.
Therefore, the combination of such a candlestick pattern with the MACD indicator can be such a powerful trading tool. This has become clear, as this article demonstrates.
If you are only using the Three White Soldiers candlestick pattern, you may consider including a momentum indicator like the MACD or RSI. If you have never used the Three White Soldiers pattern trade, then apply it in conjunction with the MACD and see how it works.
Japanese candlesticks can indicate a trend reversal. One can use these signals to buy on supports and to sell on resistances. The so-called reversal structures will have to be located on expected reversal zones. And you need to previously identify these by a new chart analysis. Using candlesticks by limiting yourself to a simple recognition of the figure without worrying about the technical context can lead to many errors.