You’ve been in Forex for a while and want to master candle trading strategy and become a professional Forex trader in the long run. Do you know how important it is to understand how strategies work in Forex? Because that way, the chances of profit increase, and you want to enrich your knowledge with candlestick strategy in Forex?
First, whether you are experienced in trading in the volatile and dynamic foreign exchange market or have just stepped into this world, you must improve yourself daily and learn valuable strategies that can greatly help you.
To successfully master the candle trading strategy, let’s first see what it represents and how useful it is, especially for ambitious Forex traders motivated to earn a large amount of money and become professionals in this profitable business.
What is the candle trading strategy in Forex exactly?
To master the candle trading strategy in Forex, it’s essential to comprehend that candlestick analysis involves closely scrutinizing price movement over a specified period. These periods are usually known as candlesticks to make informed trading decisions.
By observing patterns in the price trend, such as a sustained upward movement over several candlesticks, it is possible to predict further price increases with high accuracy. Candlestick charts provide a visual representation of the fluctuations in the value of a financial instrument, such as a stock, commodity, or currency.
These charts display the highest and lowest prices and opening and closing prices during a certain time frame. In this way, candlestick charts offer valuable insights into the momentum and direction of a tradable asset.
What do candlesticks indicate?
Candlestick charts only reveal the relationship between the open and close prices and do not provide information on the sequence of events between these prices or whether the high or low came first.
As a general rule, the length of the body in a candlestick chart reflects the intensity of buying or selling pressure. Candlesticks with shorter bodies suggest minimal price movement and represent a period of consolidation.
Momentum strategy – explained.
The principle of momentum investing involves identifying the direction in which a financial security’s price is moving. It also involves using that particular information to predict future price movements.
Those who’re thinking about how to master a candle trading strategy should understand that this all is able to be determined by analyzing the upward or downward trend of the price over a given time frame. For instance, once the famous company Tesla began exporting cars to China in February 2020, the stock price steadily increased until the 19th.
This upward momentum can be used to indicate potential future price increases. On the other hand, downward momentum can also be observed, such as the steep drop in oil prices during the Covid-19 pandemic due to the oil war between Russia and OPEC. This downward trend can indicate the possibility of further price decreases.
How to read candlestick charts in Forex?
To learn effectively how to read candlestick charts in the Foreign exchange market, it’s essential to know that there are different types of candlestick patterns. As a motivated Forex trader, you’re able to utilize some of the most well-known candlestick patterns.
Knowing that candlestick charts are essential for analyzing market sentiment and providing insights into bullishness, bearishness, and neutrality is crucial. Some of the most commonly utilized patterns provide valuable information on these market conditions.
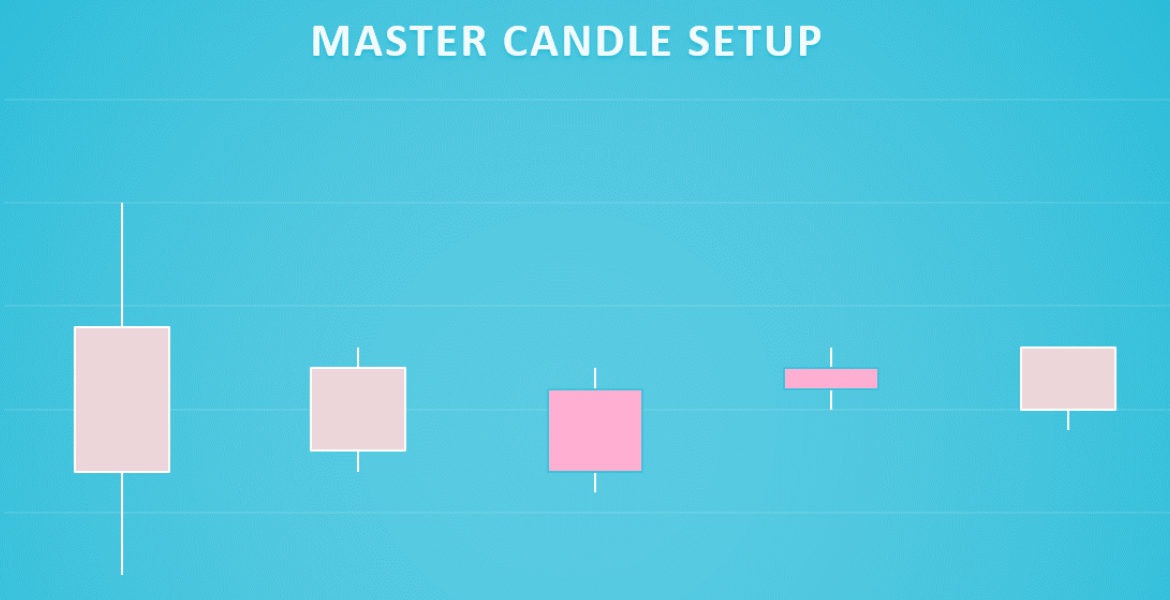
When studying candlestick patterns, it is crucial to understand the distinction between basic and advanced patterns. The number of candlesticks needed to form a pattern is a key differentiator. Basic patterns typically involve only one candlestick, whereas more complex patterns usually require two or more candlesticks to be formed.
Different types of candlestick pattern
Different types of candlestick patterns exist, but professional traders often rely on the most popular patterns that provide indications of market sentiment, such as bullishness, bearishness, and neutrality.
For instance, we’ve got the Three White Soldiers pattern, which is rather complex as it requires three candlesticks to form, while a pattern like the Bullish Harami requires only two candlesticks. The Bullish 3-Method Formation is another example that requires four candlesticks to be formed.
It’s important to note that the location of these patterns on the chart is crucial in understanding their significance.
As you gain proficiency in identifying and interpreting simple and complex candlestick patterns, you can begin to apply them in your trading decisions.
In what way are you able to profit from candle trading?
Some people are very interested in learning, in addition to, how to master the candlestick trading strategy and understand how to profit from it. Once you become proficient in interpreting candlestick patterns, you can incorporate this skill into your overall trading approach to enhance the precision of your market entries and boost your performance as a trader.
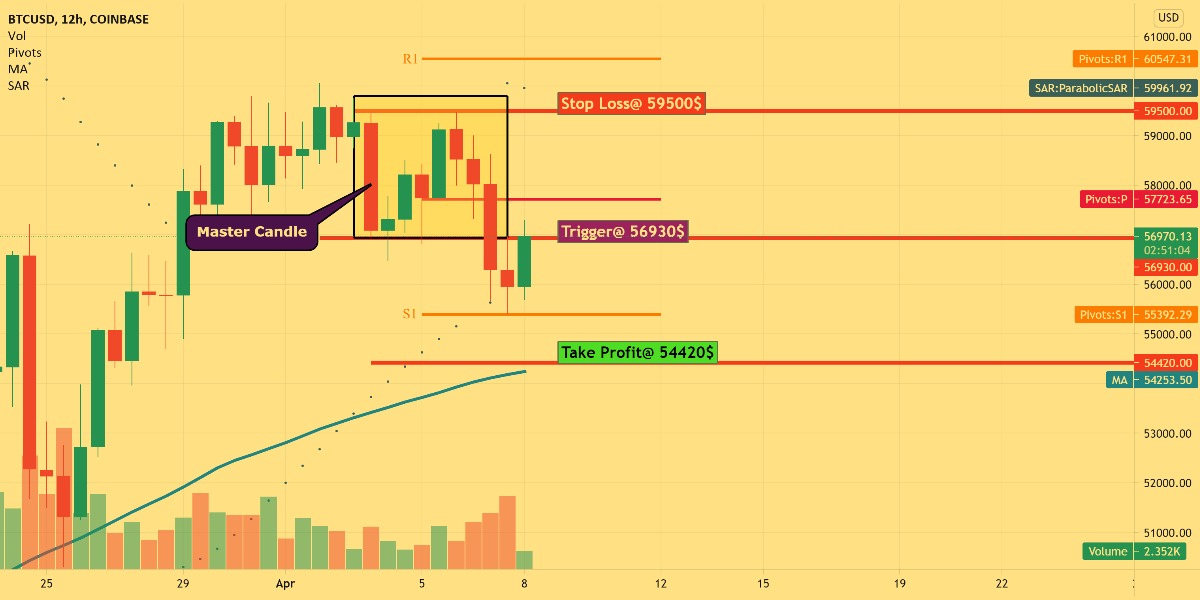
Candlestick patterns are beneficial for identifying key levels of support and resistance and affirming your predictions about market movements. However, it’s important to note that candlestick charts have limitations and cannot provide information on certain aspects, such as the reasons for similarities or differences in open and closed prices.
Open a brokerage account.
You need a brokerage account to fully leverage the insights from reading candlestick charts and invest in an asset. The best way to gain confidence in using candlesticks in your trading is by opening a demo account and practicing applying your knowledge.
Once you feel comfortable reading candlestick charts, you can open a live account and use your experience to improve your long-term trading performance.
What should you need to know about Japanese Candlesticks?
The origins of candlestick charts in forex trading are able to be spotted back to 18th century Japan, where rice farmers first developed the technique. In his 1991 book “Japanese Candlestick Charting Techniques,” Steve Nison introduced the concept of candlestick patterns to the Western world.
Before Western traders adopted bar and point-and-figure charts, candlestick charts had already been used for centuries. Homma, a Japanese trader, recognized the role of emotions in the rice market and developed candlesticks to represent those emotions and the size of price movements visually. Candlestick patterns are used to make predictions about the short-term direction of prices.
Some of the most common Japanese candle formations include the Doji, Hammer, Spinning Top, and Marubozu, which traders use to determine price direction and momentum.
How to master any strategy in the Forex market?
Regardless of how you look at how to master a candle strategy, the principle of mastering strategies in the Forex market is the same in most cases. Here are the most useful tips on how to master a candle trading strategy, such as any other in the Foreign exchange market:
Define your trading style and goals
Before embarking on any venture, you must clearly understand your destination and the path you will take. Similarly, it’s crucial to have specific objectives in trading and ensure that your chosen method aligns with those goals. Each trading strategy has a distinct risk profile that requires a particular mindset and approach to be successful.
For instance, if you are not comfortable holding open positions overnight, day trading may be a better fit. On the other hand, if you have capital that will benefit from the growth of trade over an extended period, position trading is more suitable. It’s important to ensure that your personality aligns with the style of trading you choose, as a mismatch can lead to stress and financial losses.
Have a consistent methodology
As a trader, it’s crucial to have a clear plan for making decisions on trade execution. This means understanding the type of information and analysis that will inform your choices to enter or exit a market. Some traders study the economy’s fundamentals and analyze charts, while others solely use technical analysis.
Regardless of the approach, consistency and adaptability are key. Your methodology should be able to adapt and evolve as the market changes.
Keep a printed record and perform analysis on weekends.

As a professional trader, it’s crucial to analyze the markets on weekends when they are closed thoroughly. You can identify patterns or news that may impact your trades by studying weekly charts.
For example, a double top pattern in combination with market predictions of reversal can indicate a reflexivity situation where the pattern is driving the predictions. By objectively analyzing the market in this way, you will be able to make well-informed trading plans, wait for the right setups, and learn to be patient in your decision-making process.
In addition, keeping a printed record of your trades can be an invaluable learning tool. By printing out charts and listing the reasons for each trade, including the fundamental factors that influenced your decision, you can mark the entry and exit points and make relevant comments. This can help you gain insight into any emotional factors that may have played a role in your decision-making, such as panic, greed, or anxiety.
By objectively analyzing your trades this way, you will develop the mental control and discipline to execute trades according to your system rather than being influenced by your emotions.
Bottom Line
Those wondering how to master candle trading strategy should remember that utilizing a candlestick chart when trading can be a valuable technique for analyzing historical data before making a trade. The candlestick pattern, with its open, high, low, and close values, clearly illustrates the direction and momentum of price movements over a specific time frame.
If you’re interested in momentum trading, check out our course on Momentum Trading Strategies. Through this program, you will learn to create time series and cross-sectional momentum strategies for various assets like stocks, stock indices, fixed income, and commodities futures.
Additionally, you will be able to quantitatively evaluate time series, portfolio returns, and risks and construct and test momentum trading systems.