Good day traders! Check now the most recent charts and market updates for today’s session. Learn more about analysis and be updated on the current happenings in the market!
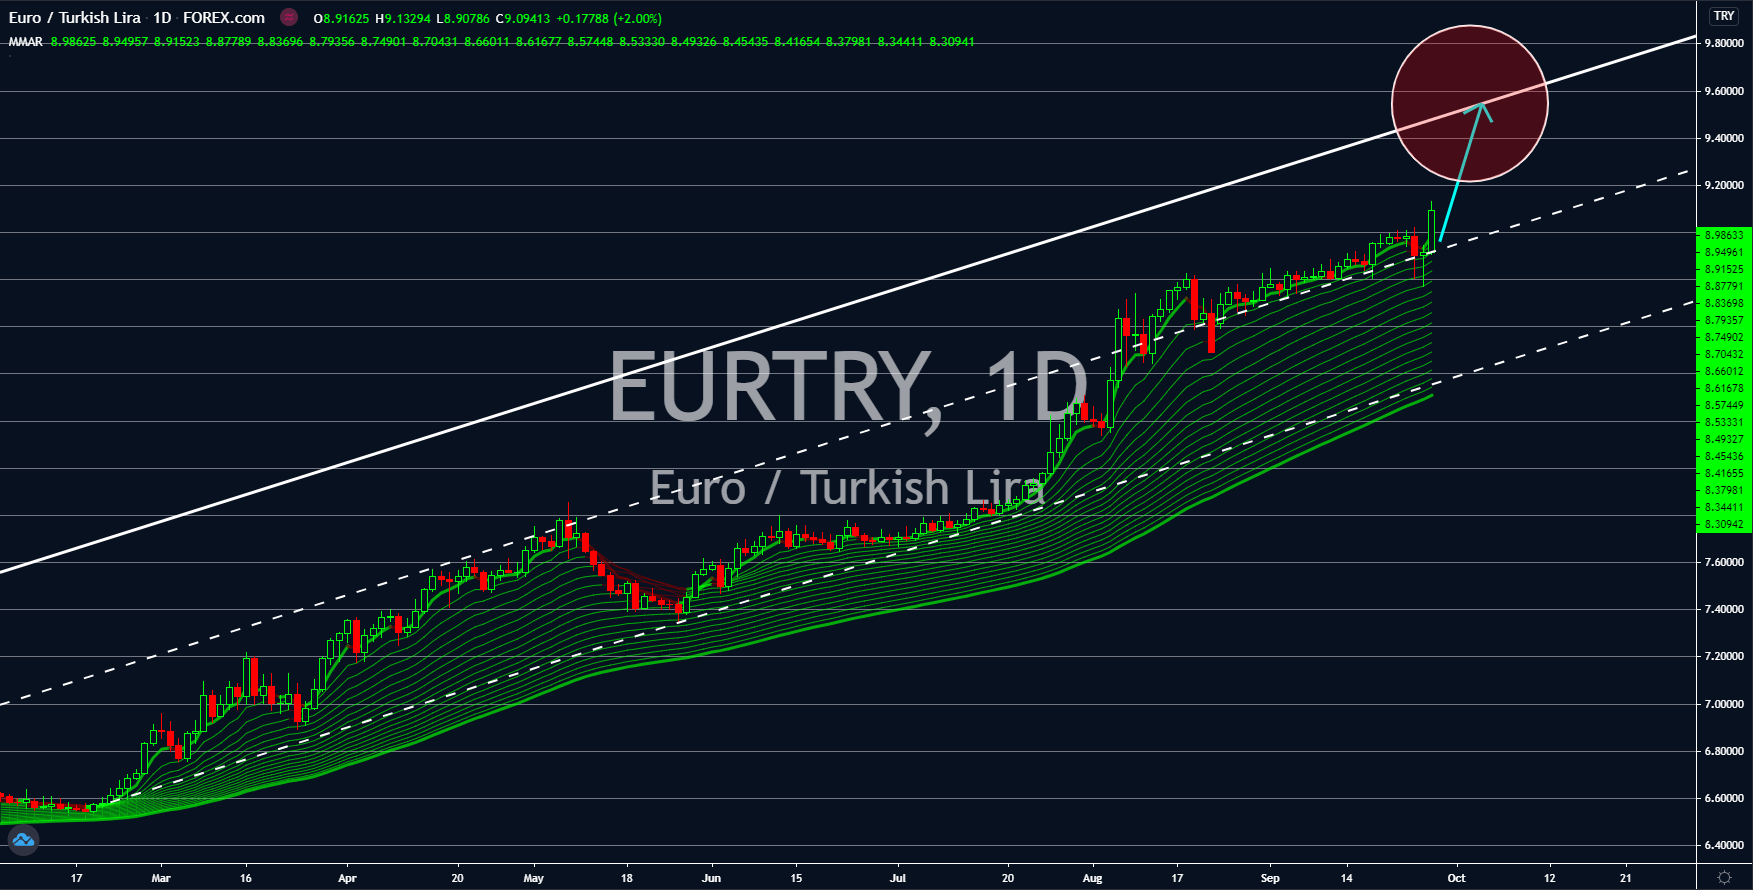
EURTRY
The supply of the euro currency in the market has slowed down. The figure for Eurozone M3 Money Supply YoY increased by 9.5%, a much lower rate than July’s 10.1% and lower than 10.2% expectations. This was bullish news for the EUR traders as the lower supply of the currency will lead to the increase in the value of the euro. Furthermore, Germany’s reports for Current Assessment, Ifo Business Climate Index, and Business Expectations all posted higher numbers than their previous month. Figures came in at 89.2, 93.4, and 97.7 points, respectively. On the other hand, foreign arrivals in Turkey recorded -71.23% decline. Investors are worried with the country’s internal and external obligations as its total reserves was lower than its 12-month debts. Ankara’s booming tourism sector is an integral part of building its foreign reserves. However, the global lockdown brought by COVID-19 is starving the country of foreign currencies.
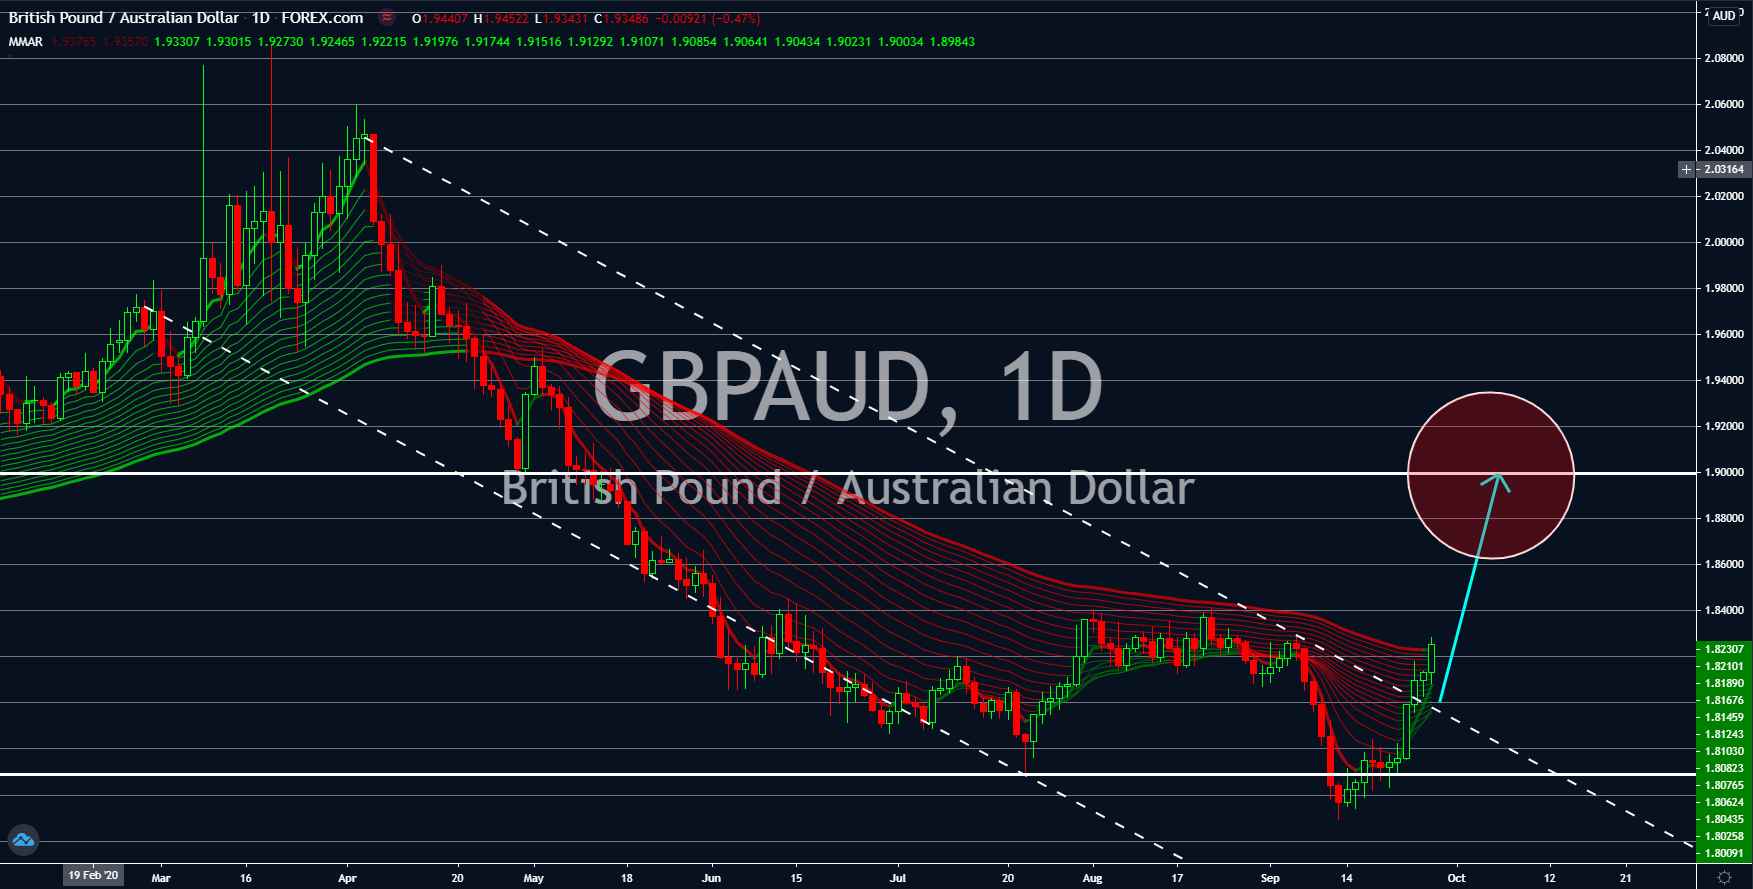
GBPAUD
Australia is running out of bullets to combat its largest economic crisis in almost three (3) decades. Despite incurring a $200 billion budget deficit, the country is yet to achieve its forecasted U-turn economic recovery. Moreover, it is currently facing a high unemployment rate coupled with possible bankruptcies of large Australian airlines, Qantas and Virgin. Unemployment in the country will remain at 7.9%, according to a recent report, for the fiscal year. This will rise 8.0% in the following year before it can see a modest improvement of 6.8% by 2022 to 2023. Australia’s most recent economic stimulus was made on Friday, September 25. The country said it will be easing bank requirements to encourage borrowing from consumers. Meanwhile in the United Kingdom, a positive growth has been recorded in the recent Public Sector Net Borrowing report. Figures more than doubled from $14.72 billion in July to $32.20 billion last month.
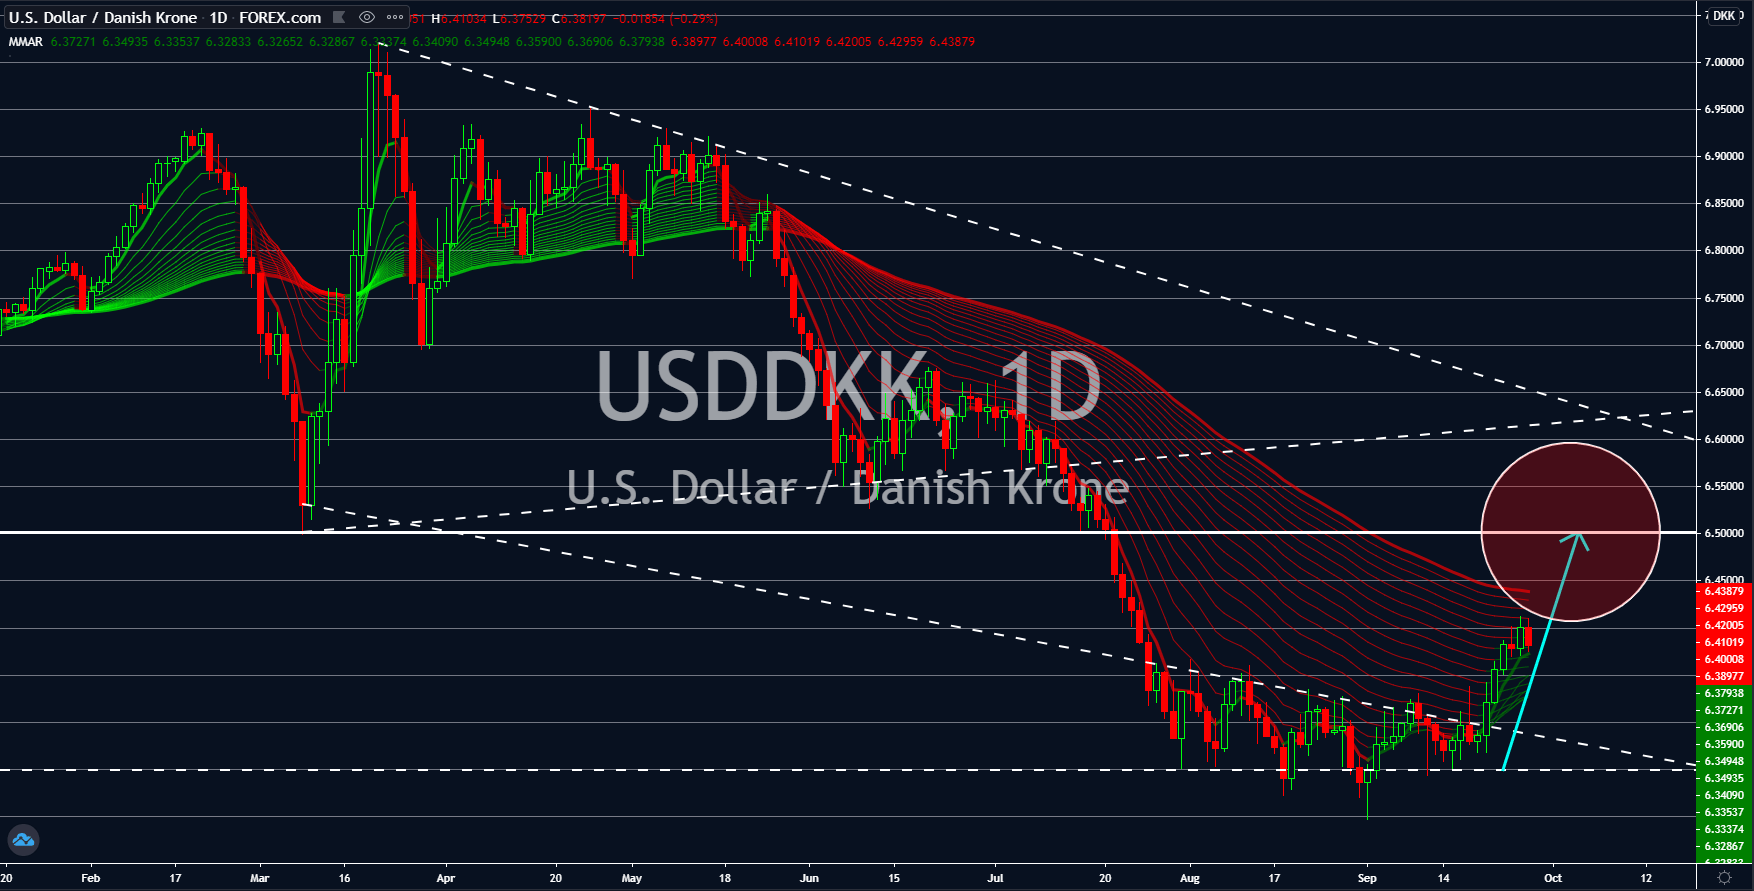
USDDKK
Investors and analysts are now betting on a stronger US dollar in coming sessions. This was following the continued improvement in the country’s initial jobless claims report. On September 24, Thursday, the report added 870K claimants, 4,000 higher than the prior week. Despite this, a clear trend shows people claiming unemployment benefits now only sitting at 800K level for the past four (4) weeks. In addition to this, consumers are now spending money as seen in the recent New Home Sales report. Around 1,011K houses were bought in August, the highest since October 2006. This suggests the confidence that the consumer has with the American economy despite the pandemic. On the other hand, Denmark, just like the rest of the EU countries, are struggling to revive their economy. Among its most recent and probably largest economic news his month was just about its improved bilateral summit with India.
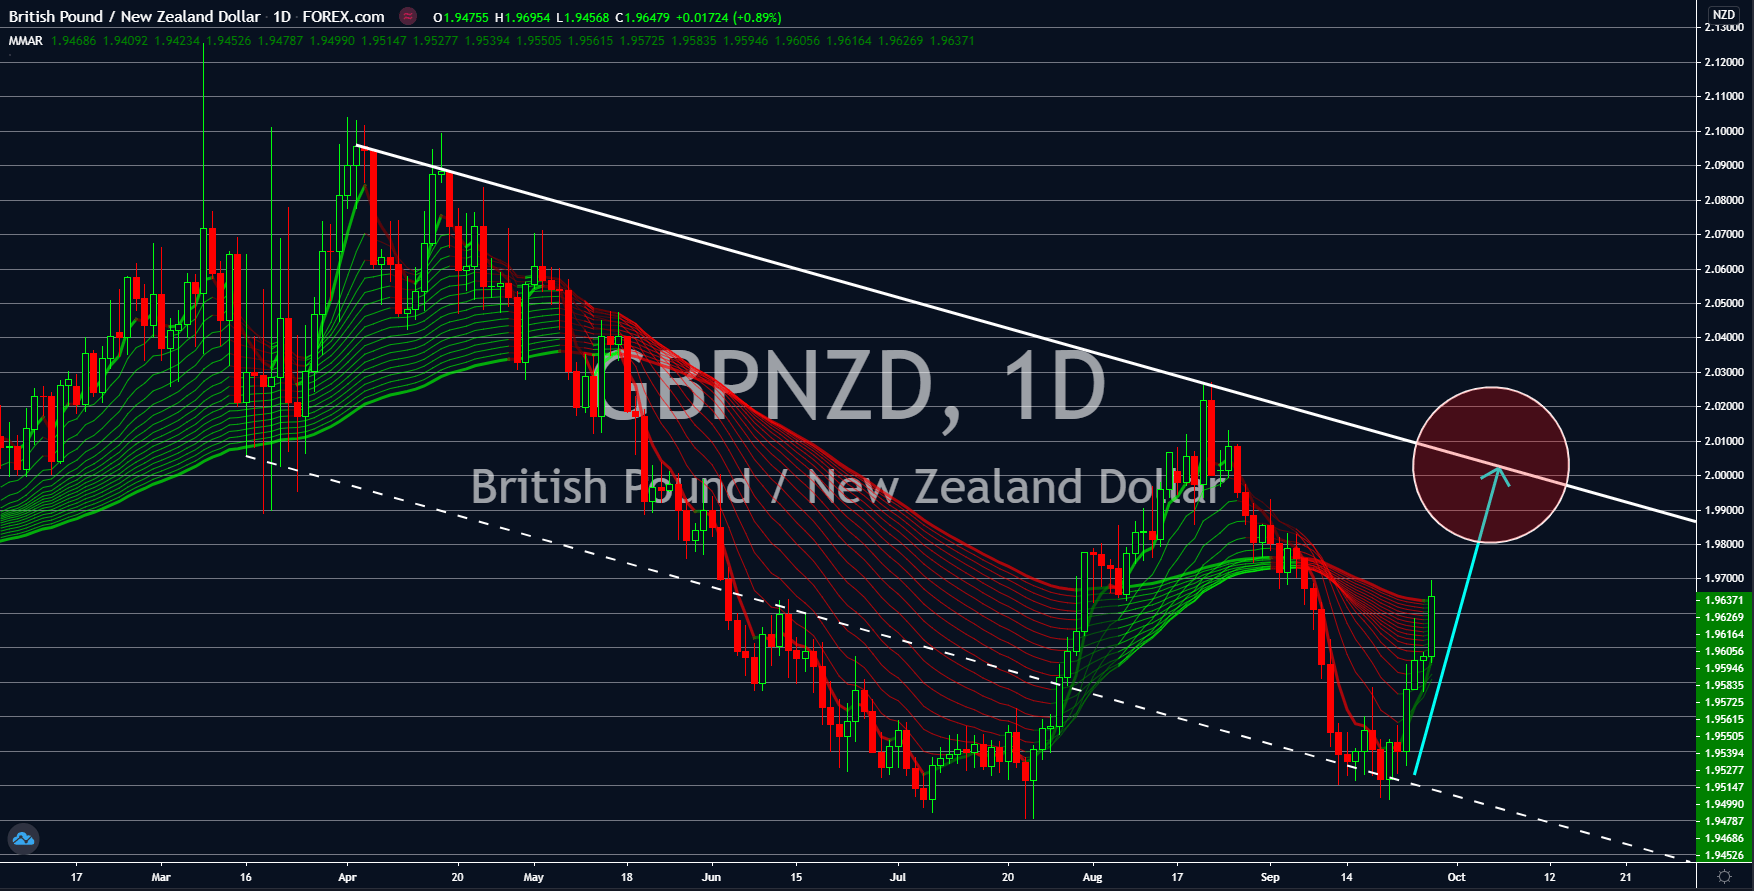
GBPNZD
A rally in the British pound is expected to continue in the coming days. The catalysts for this movement was last Friday’s reports for Public Sector Net Borrowing and Net Cash Requirement. Figures for these reports came in at $32.20 billion and $25.69 billion, respectively. These two (2) figures showed a massive improvement from their previous records of $14.72 and $16.49 billion for the month of July. Net cash requirements represent the liquidity in the public sector, which consists of the central government, local authorities, and public corporations. Meanwhile, net borrowing shows the amount of liquidity that the public sector has. The more liquidity in the market, the better opportunity for corporations to raise cash and support their operations. On the other hand, investors were divided with the candidates in the upcoming New Zealand election. The Nationalist Party had stepped up their game by promising $4,000 to unemployed citizens.