Good day traders! Check now the most recent charts and market updates for today’s session. Learn more about analysis and be updated on the current happenings in the market!
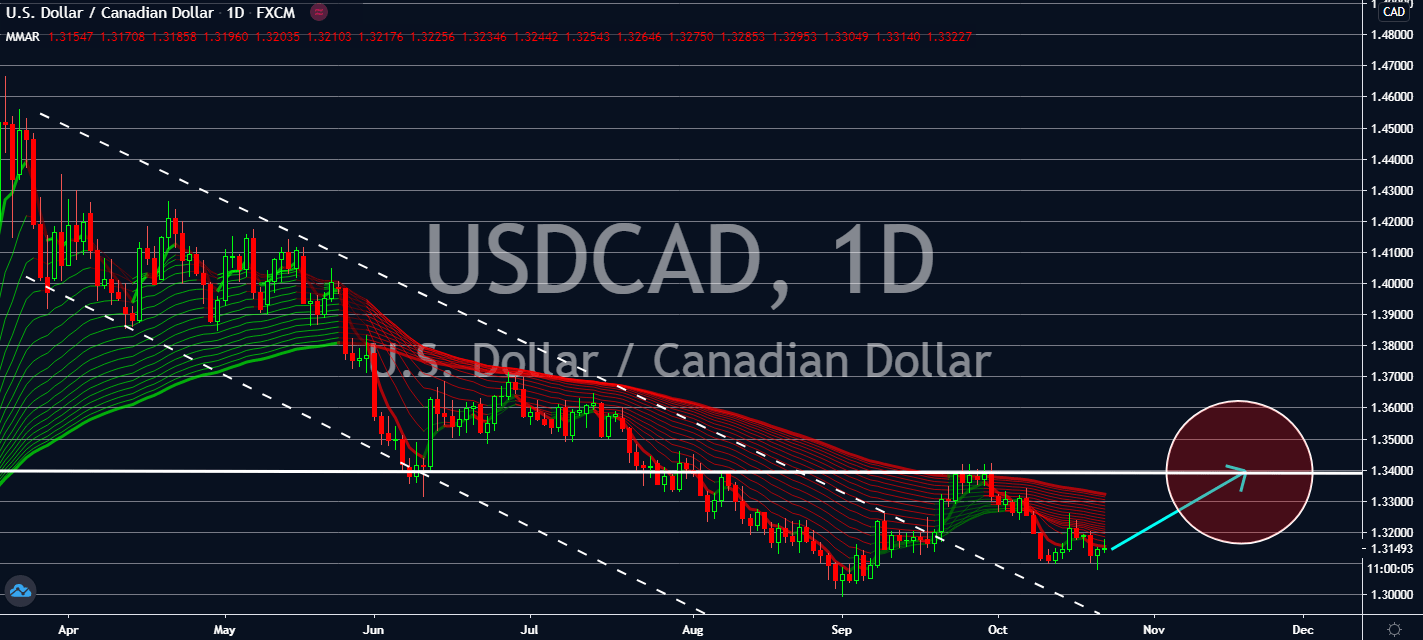
USDCAD
The market seems to have experienced exhaustion for the US dollar against the Canadian loonie. Several economic indicators in the US are likely to be the main driver for the pair as uncertainty around stimulus packages keep investors on the edge of their seats until the presidential elections next month. Initial Jobless Claims are projected to report a lower number this week, raising expectations that the spike to August highs would be a one-time occasion. The figure is expected to fall to 860,000 from the 898,000 files for new unemployment claims. The country’s home sector seems to have been improving more as of late – Existing Home Sales will also boost in September from 6.00 million to 6.30 million, a figure that could pile onto the market’s interest from the 14-year high achieved in August. It looks like the increase last month was its fastest pace since 2006. The expectations for the figure will improve the greenback’s recovery near-term.
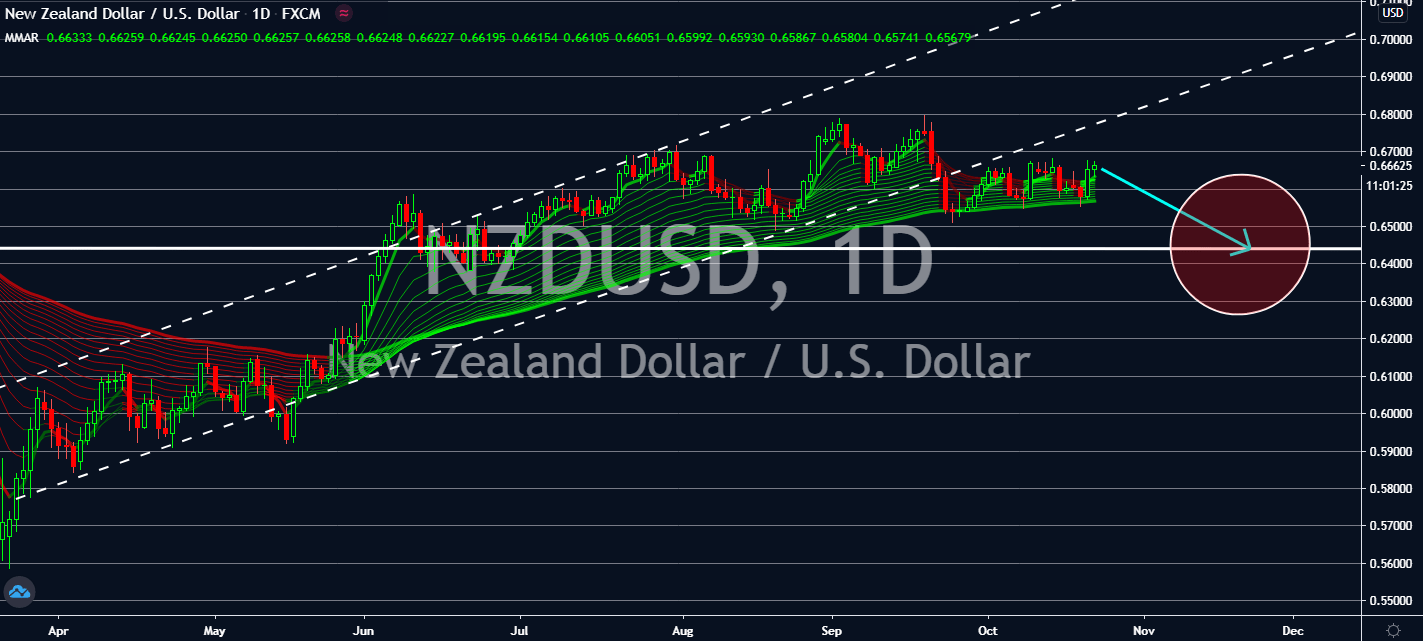
NZDUSD
The US dollar is likely to benefit from House Speaker Nancy Pelosi’s claim that its economy might not be getting another stimulus package to help businesses until after the presidential elections next month. Investors could continue to remain optimistic towards its economy, especially while waiting for several notable economic indicators that will be announced later today, such as existing home sales and initial jobless claims. Both indicators achieved record-breaking results last week, but for contrasting records. While analysts claim that existing home sales will reach even further up from its fourteen-year high seen last month, they’re also expecting that lesser people have registered for unemployment for the past week. These figures will offset the expected uptick in New Zealand’s quarterly CPI figures for Q3, which is projected to lift from -0.5% in the second quarter to a positive record of 0.9% achieved three months ending August.
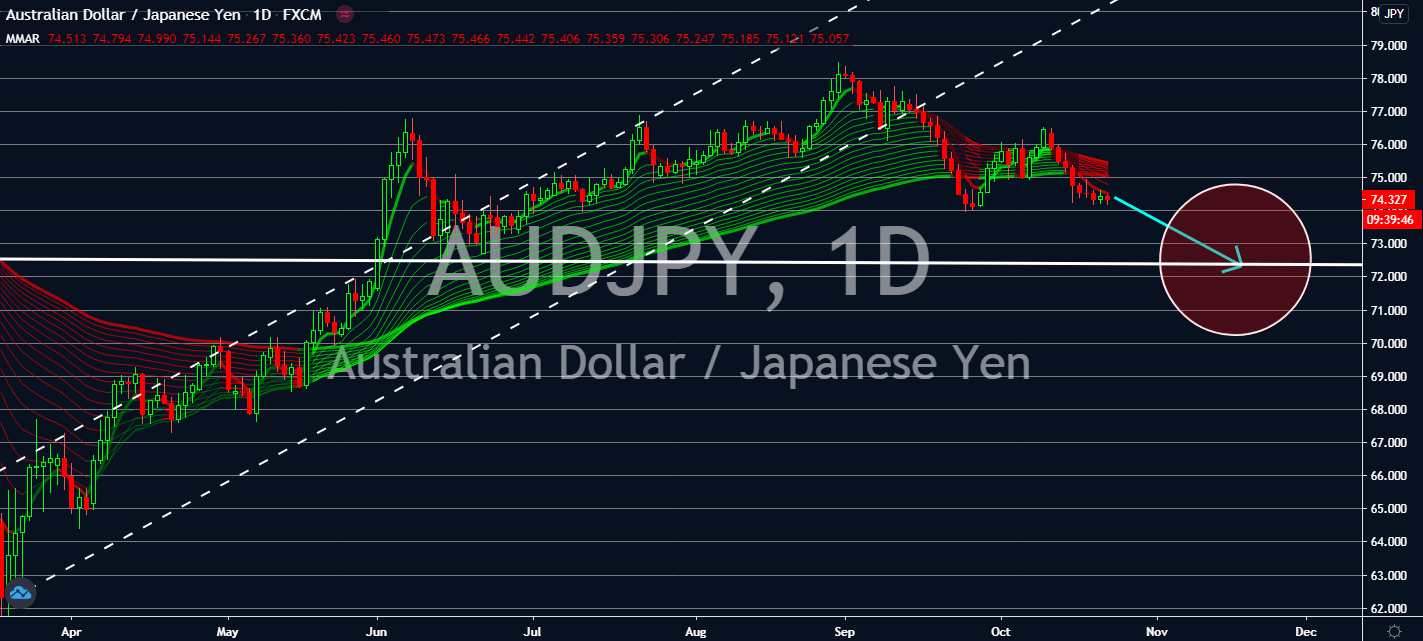
AUDJPY
Asian assets like the Japanese yen are projected to lift thanks to recent improvements in the Chinese economy. China posted a 4.9% economic growth in the third quarter in comparison to last year, a move that offset the lack of data expected in Japan’s economic calendar. Moreover, Japan’s GDP expanded by 0.6% in August. This was a sign that its recovery from the coronavirus has been on track even before Yoshihide Suga took Shinzo Abe’s place as the country’s prime minister. The solid foundation for its growth is projected to assist Suga’s reign throughout the rest of the pandemic as he stabilizes Japan’s geopolitical relationships. Meanwhile, Australia seems to be struggling with its own recovery. Its tension with the Chinese economy, especially as the largest economy in Asia thrives, will only be beneficial for the Aussie’s counterparts because of its dependency on China’s demand for several of its commodities.
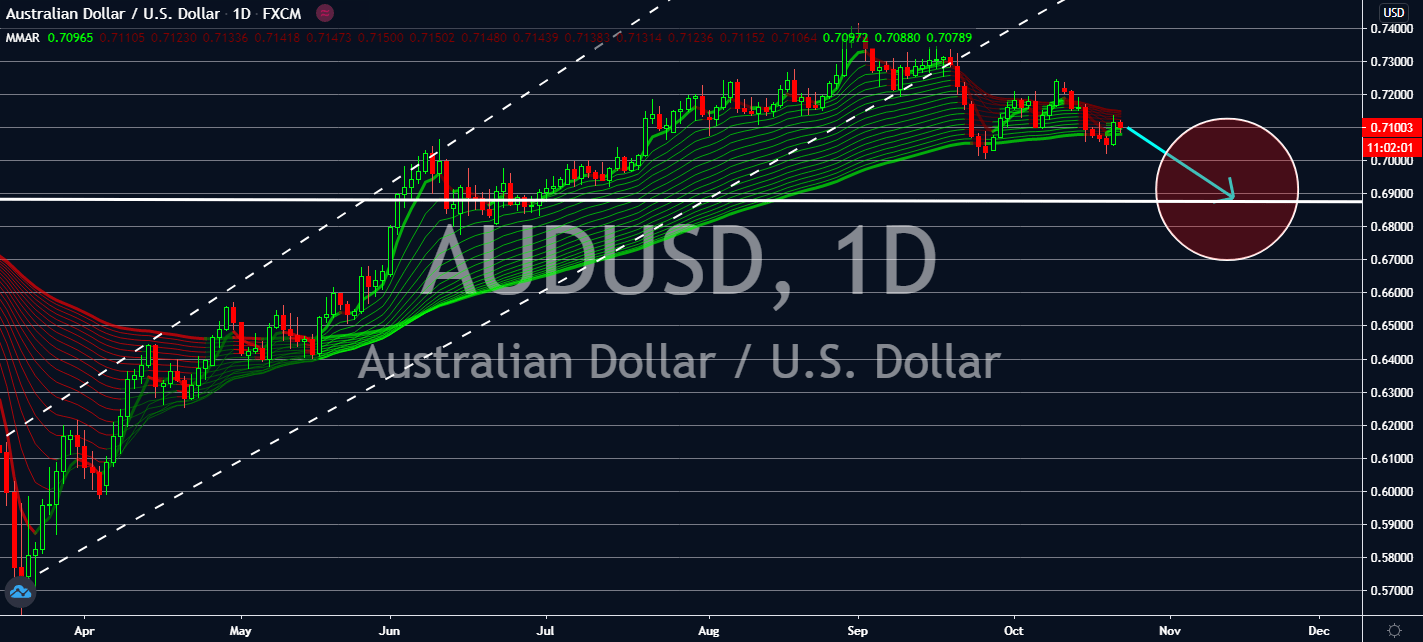
AUDUSD
Australia’s increasing tension with China is likely to pull the Aussie down near-term, in comparison to an expected improvement in US economic data for today. Investors are also expected to drive away from the Aussie over fears that there wouldn’t be any stimulus packages in the country before the November elections, raising the need for safer assets near-term. Australia is going through a shadow trade war with China, its biggest trading partner for several commodities like agriculture, coal, and cotton. As China’s GDP expands, seen by the 4.9% yearly increase in the third quarter, the Australian economy is likely to suffer if it chooses to stop importing from Australia. After all, the country down under isn’t China’s main trading partner. The Aussie dollar is projected to fall as the fire burns in the shadow war, and the US economy continues to improve its employment and home sector for the next quarter.