Good day traders! Check now the most recent charts and market updates for today’s session. Learn more about analysis and be updated on the current happenings in the market!
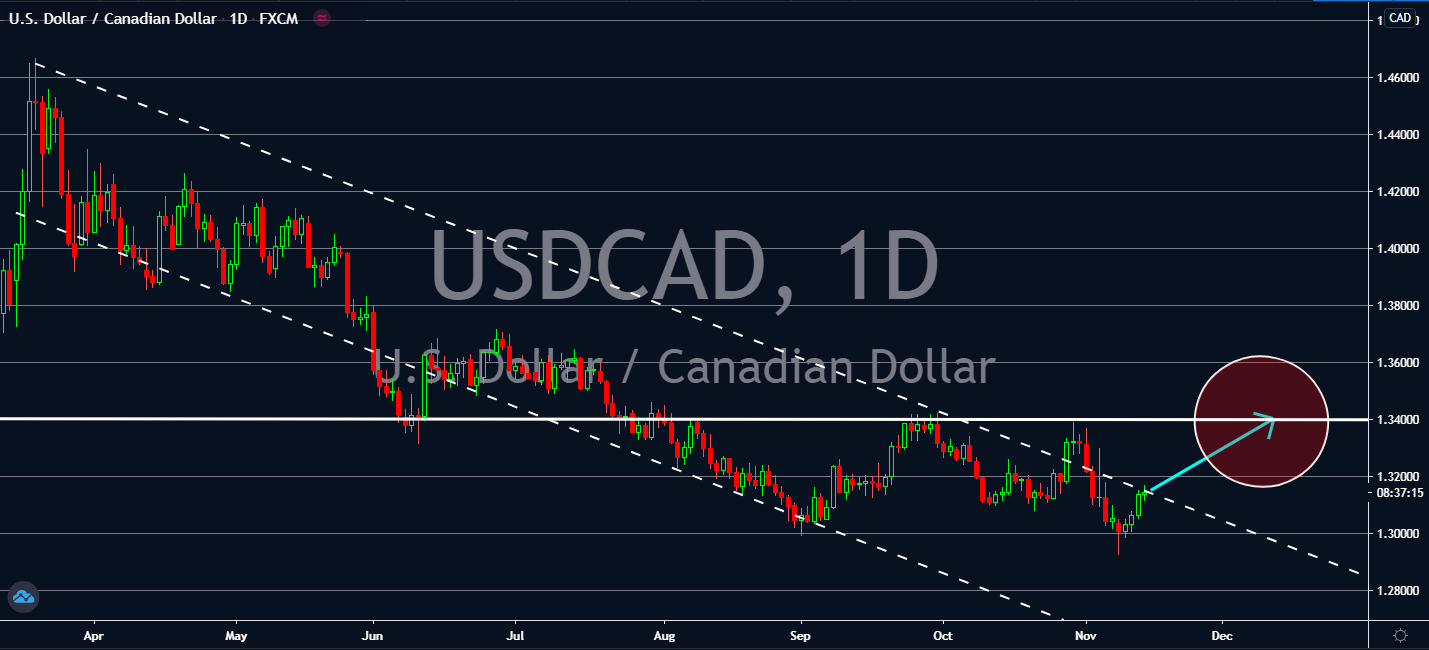
USDCAD
The Bank of Canada is getting worried about the recent surge in coronavirus cases in the country. Its daily cases just set a new record of 4,975 and added 83 more deaths on Thursday. Ontario also broke its daily count record for the third time in a row, reporting 18 more deaths, the largest increase since the beginning of October. Senior Deputy Governor Carolyn A Wilkins claims that the economy has less potential to grow than it did in prior estimates. Its hospitality and recreation sectors, which include the younger demographic, recent immigrants, and women are likely going to be the hardest-hit sectors in upcoming months. The rising death tolls will be Canada’s biggest concern as the central bank keeps its focus on increasing productivity and overall activity in its market. Until the development of a vaccine progresses significantly within this month, the Canadian loonie is likely to fall greater than its greenback opposite.
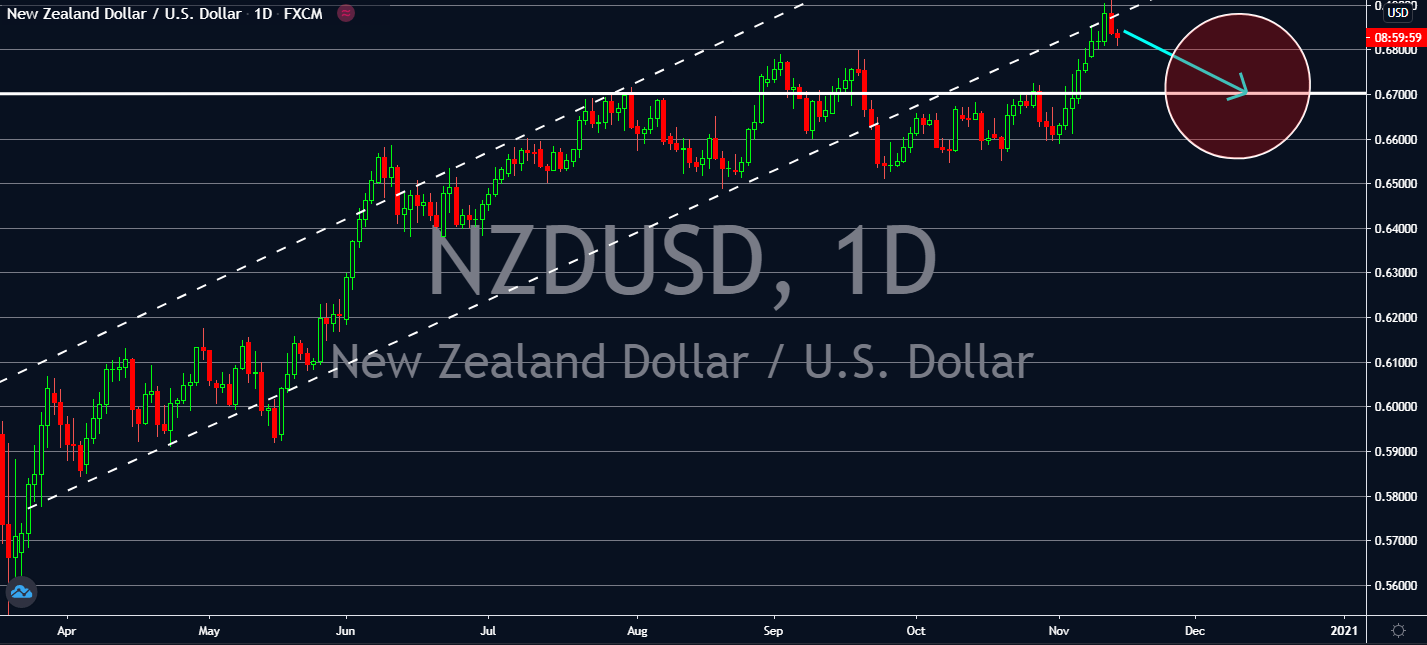
NZDUSD
New Zealand will end the weak with weaker numbers amid its week-long rally. BusinessNZ Manufacturing showed a slowdown in October from 54.0 to 51.7, while Production dropped from 56.7 to 51.1 and New Orders went down from 58.1 to 52.4. The losses will likely knock investors’ heads out of optimism towards its economy despite its quick recovery from the economic effects of the coronavirus. Since contraction is marked when each figure reaches below the 50-point threshold, investors are projected to keep holding their kiwi investments in the near-term. This is considering that its employment index improved only slightly from 51.7 to 52.6. For now, the market will likely want to benefit from the near-term risk aversion for the greenback thanks to the positivity around better trade and geopolitical relationships with the largest economy in the world. The US is also projected to continue its improvement in employment near-term.
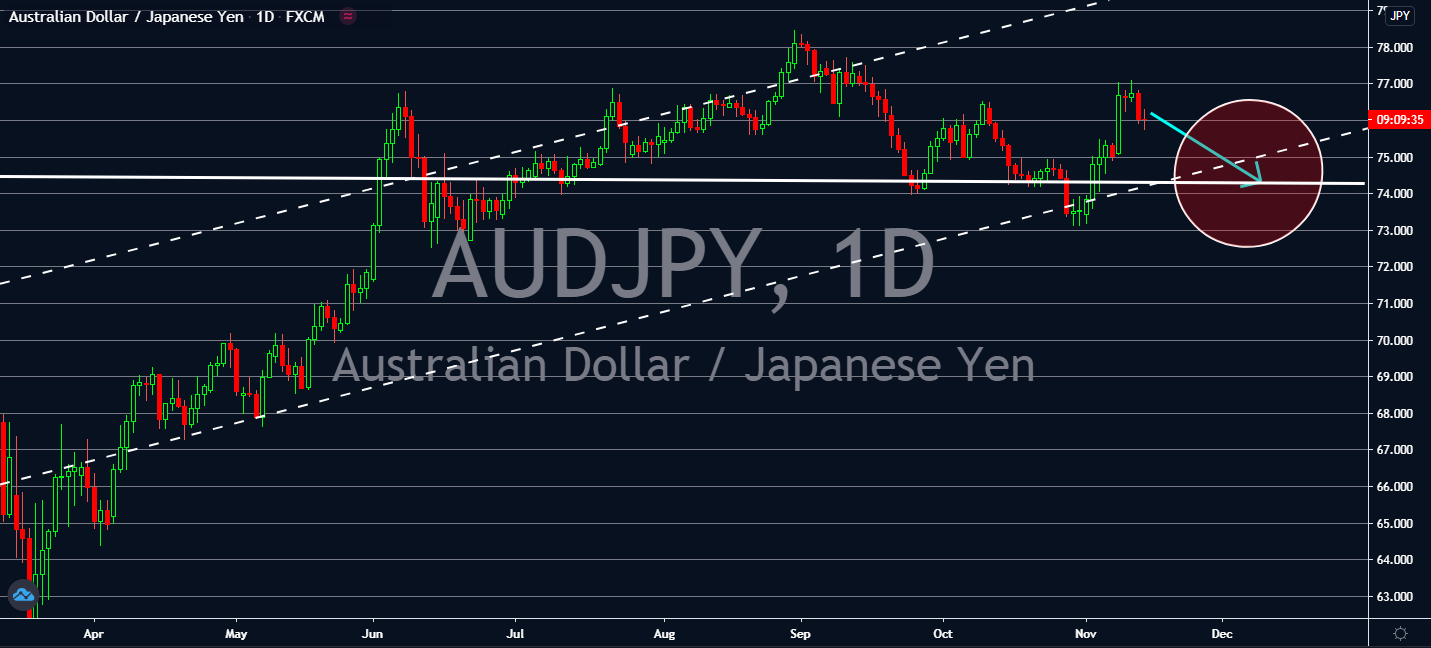
AUDJPY
Japan will seek to assist Washington with its fiscal stimulus to revive the world’s economy in exchange to restart negotiations of its Trans-Pacific free trade pact it quit three years ago. Prime Minister Yoshihide Suga asked to compile a third extra budget for the fiscal year ending March, hoping to implement another package to help its economy recover from the effects of the coronavirus. The 10 trillion yen to 15 trillion budget came soon after forecasts claim that Japan saw an annualized 18.03 percent growth in gross domestic product, which was a large increase from the 28.1 percent contraction it had seen the month prior. The speed at which the Japanese economy has grown this year is likely to offset any attempt from Australia to overshadow it, driving market sentiment toward safe haven currencies like the Japanese yen. Biden’s win will also help lift Asian stocks in the longer-term from possible improvements in trade relationships.
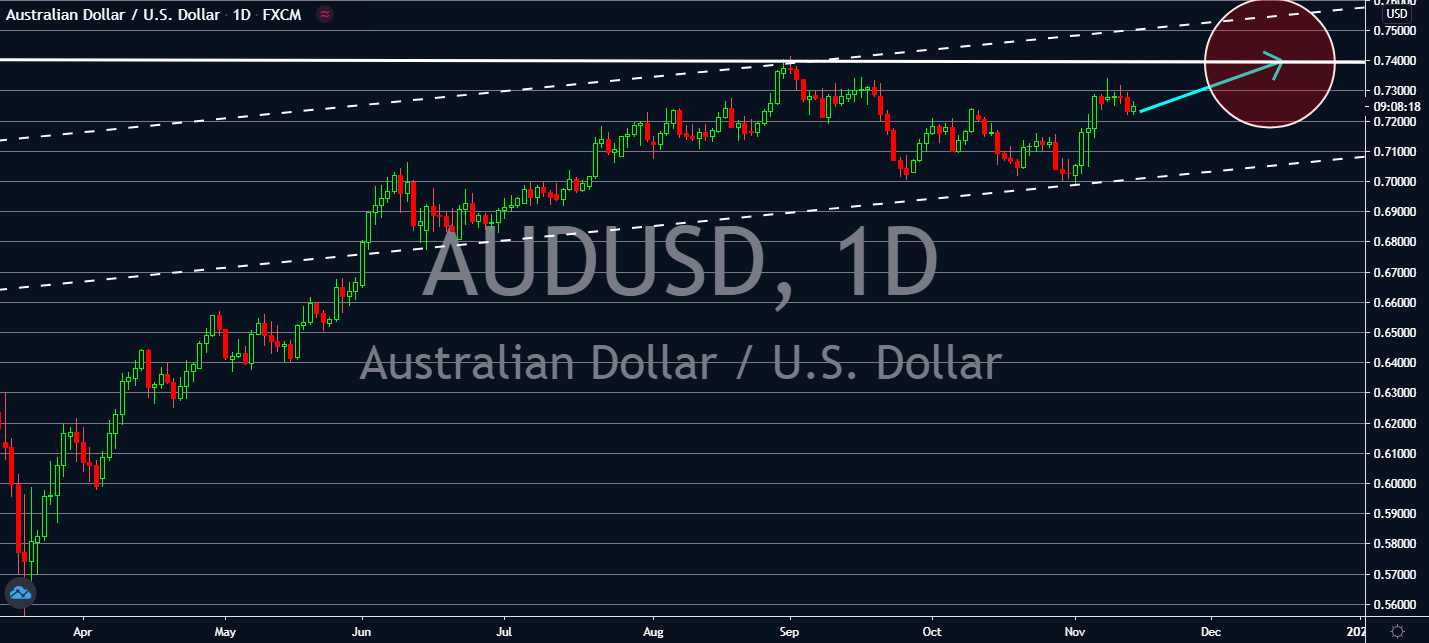
AUDUSD
Australia is showing signs that its economic improvement will be strong over the next two years, according to multiple reports. See, Australia had seen its gross domestic product and employment collapse over the second quarter of this year. Comparisons were made between this year and the Grea Depression, now that its economy had seen itself contract to its sharpest since the 1930s. However, economists have claimed that the economic comparisons should only involve the second quarter, and not the third, because most expect the Australian GDP to grow back up by about 4.2 percent after it contracts by 3.3 percent by the end of this year. Another increase in GDP is expected within 2022 around 3.8 percent. Its unemployment rate is also expected to reach 5.75 percent by next year, down from the recent 6.9 percent record, and then would lower to 5.0 percent by end-2022. The optimism is projected to lift the Aussie dollar against its counterparts within this year.