Good day traders! Check now the most recent charts and market updates for today’s session. Learn more about analysis and be updated on the current happenings in the market!
EURUSD
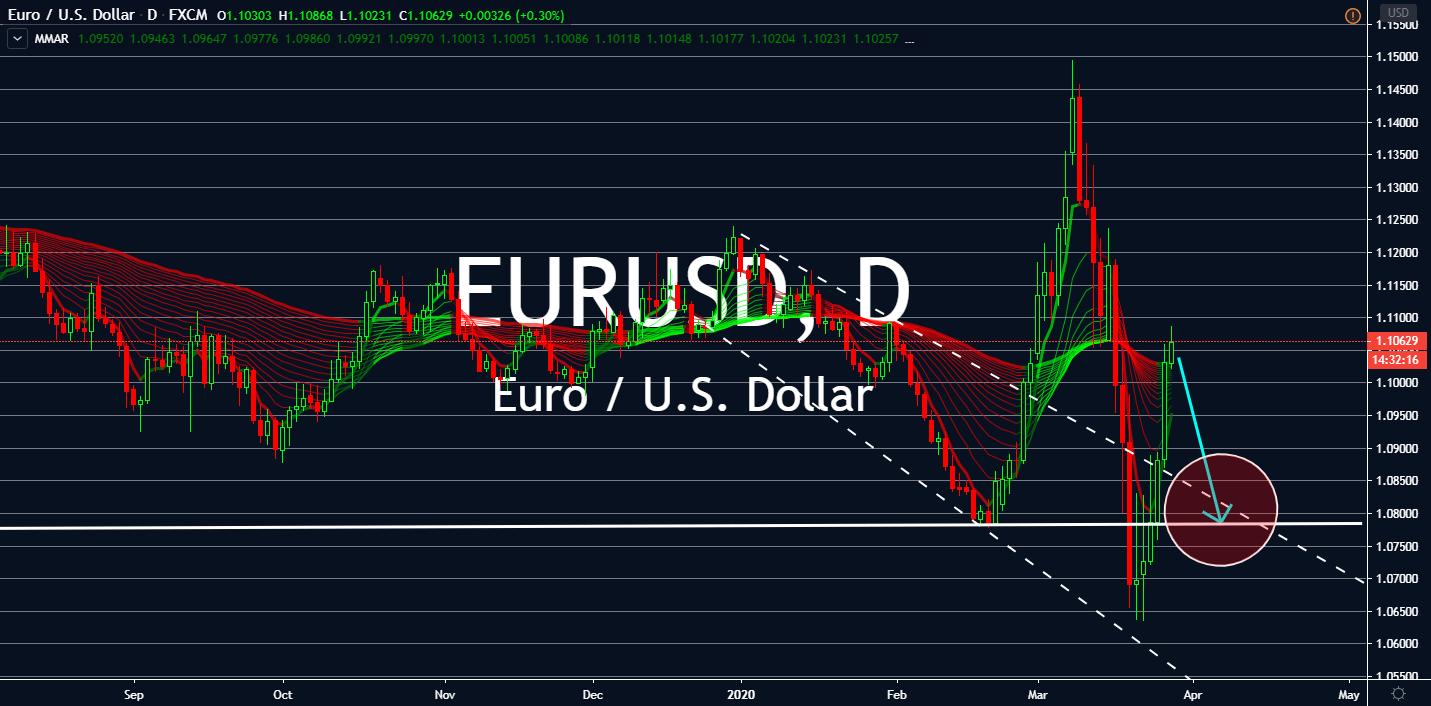
The three biggest economies in Europe, namely France, Germany, and Italy, are expected to show negative figures in the long term beginning this weekend. Nancy Pelosi’s announcement on Thursday claiming that the US Congress’ $2 trillion stimulus package is on the way will boost the dollar in the long term, forcing the pair into high volatility amid record-breaking lows in the market. The US dollar previously experienced an inverted V pattern in recent days, due to jobless claims reaching all-time highs to 3.3 million in the US. As the possibility of another interest rate cut from the Federal Reserve comes to play, the safest currency in the world has no way but up for at least a year and a half. Furthermore, Germany’s IFO Business Climate report for March fell to a lower figure than its worst performance in 2009. Meanwhile, markets are waiting for results coming from other respective countries in Europe and how the European Central Bank will react to it.
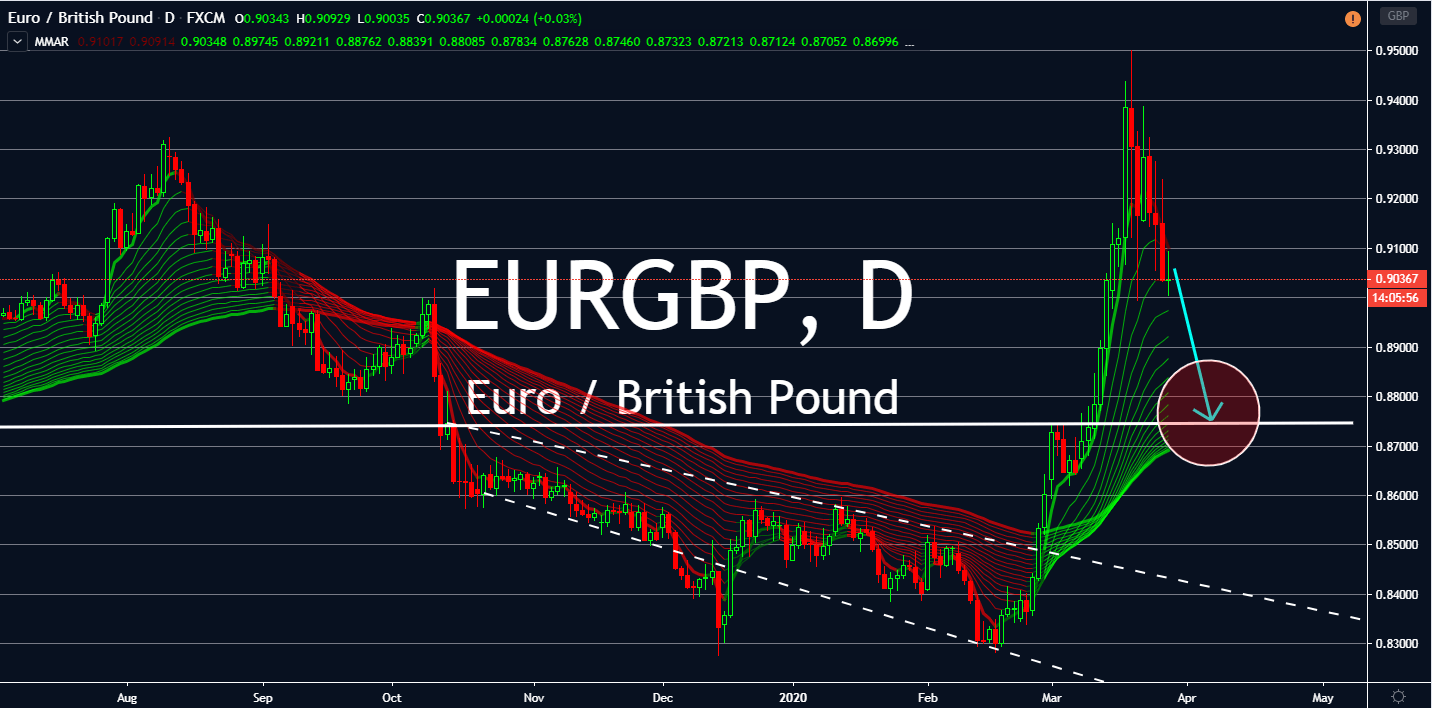
EURGBP
Rishni Sunak, the freshly appointed top finance official, is under global pressure for what reports dub as one of the greatest economic rescues in history. Sunak launched a package to pay 80% of self-employed UK citizens who lost income because of the COVID-19 lockdown in the country, in addition to layoff compensations and more than $300 billion aid for business negatively impacted by the crisis. UK lenders have begun to offer mortgage extensions for up to three months, allowing customers to push moves to a later date. UK Finance Chief Executive Stephen Jones was part of this decision with claims that it was clearly “not appropriate” for people to move while self-isolating. These movements will help encourage sentiment on the British pound as these financial executives take higher positions on the future of its country over its parliament. Unfortunately, this will shed light on the Eurozone’s possible split-up.
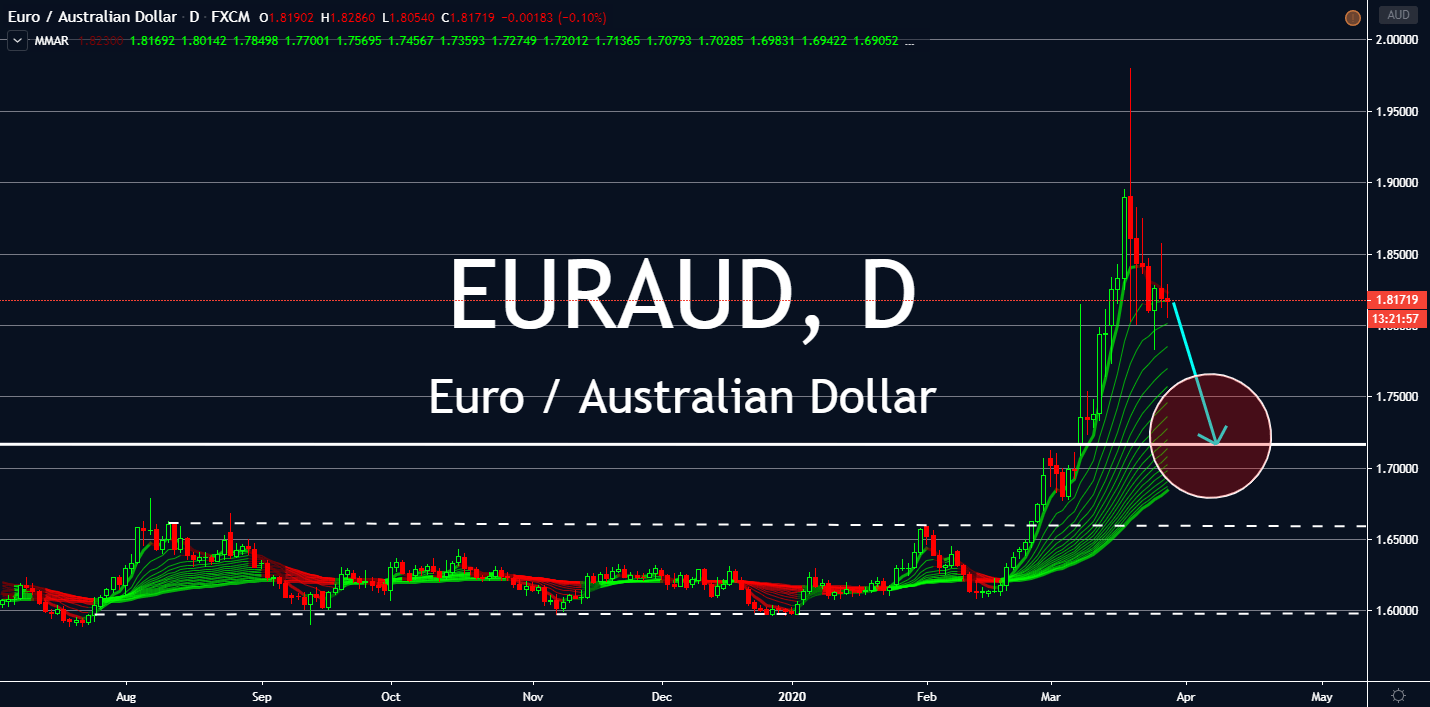
EURAUD
The single currency/aussie pair first performed the worst in major currencies on March 4. With both economies at risk of a recession, it’s likely that it would go back to that status. Fortunately for the Australian dollar, record-breaking jobless claims in the US raised the likeliness of an additional stimulus package from the Federal Reserve and the US Treasuries, raising demand for oil. As one of the biggest oil importers in the world, the new stimulus is expected to help Australia alongside new regulations on oil and gas in the country. The regulation allows the country to boost its economy with highly skilled jobs, sustainable energy, and export revenue. Meanwhile, the Euro is expected to report negative figures on some of its largest economies. Germany began the series of unfortunate events with a lower-than-expected IFO Business Climate report, sinking the figure down to lows similar to what the bloc saw in 2009.
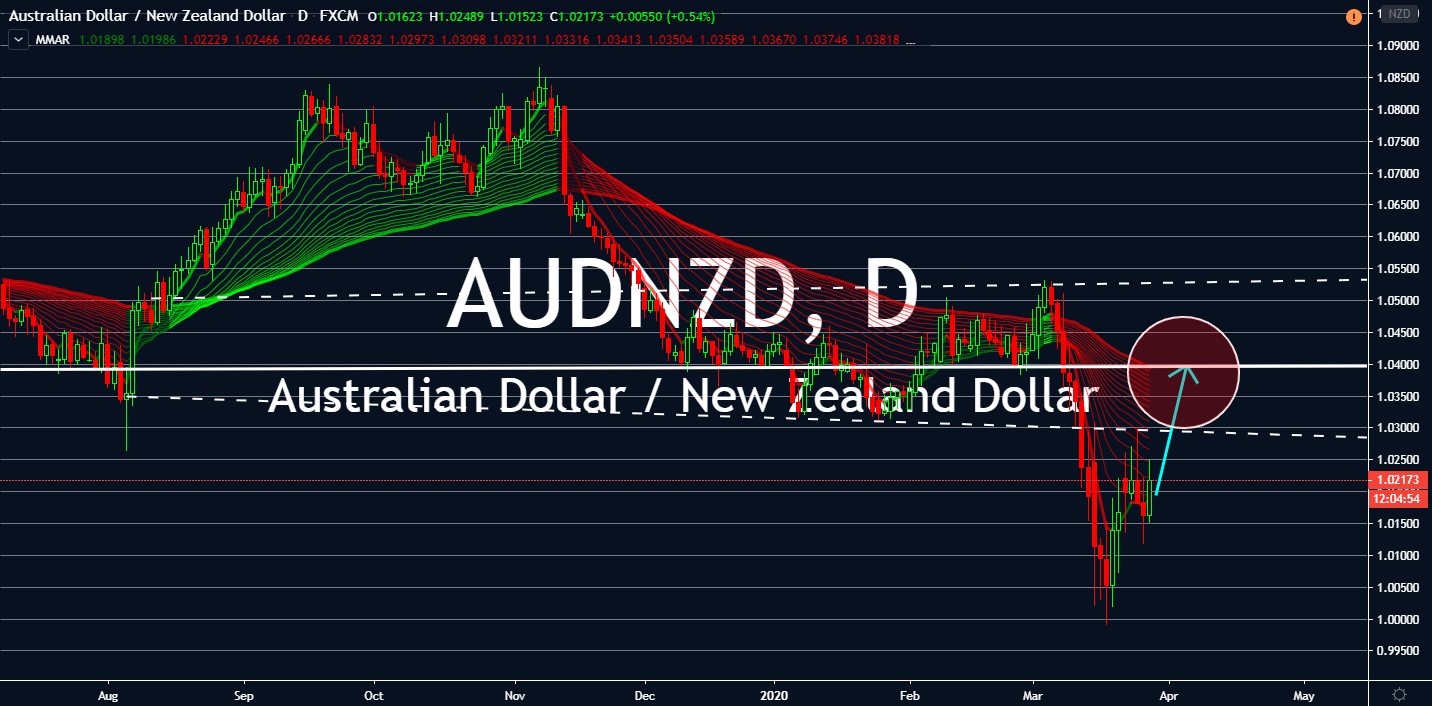
AUDNZD
After going low for almost two weeks, investors finally see the aussie going back to its previous support levels. The oil-dependent pair will see itself rising with hopes that oil will see higher demands in coming weeks, due to rising possibilities of another fiscal stimulus package from the US Congress, as well as another possible interest rate cut from the US Federal Reserve. One of the biggest oil exporters in the world is on gradual recovery after the Reserve Bank of Australia loosened its interest rates to 0.25% and issued quantitative easing in the country. While New Zealand followed suit, it’s not going to be enough for it to rise against its counterpart. Its status as the primary proxy to the Chinese yuan, it could see itself treading lows over rising tensions against China. As more coronavirus deaths ironically proliferate in the country, markets are looking for any signs of improvements in New Zealand to gauge when to buy or sell.