Good day traders! Check now the most recent charts and market updates for today’s session. Learn more about analysis and be updated on the current happenings in the market!
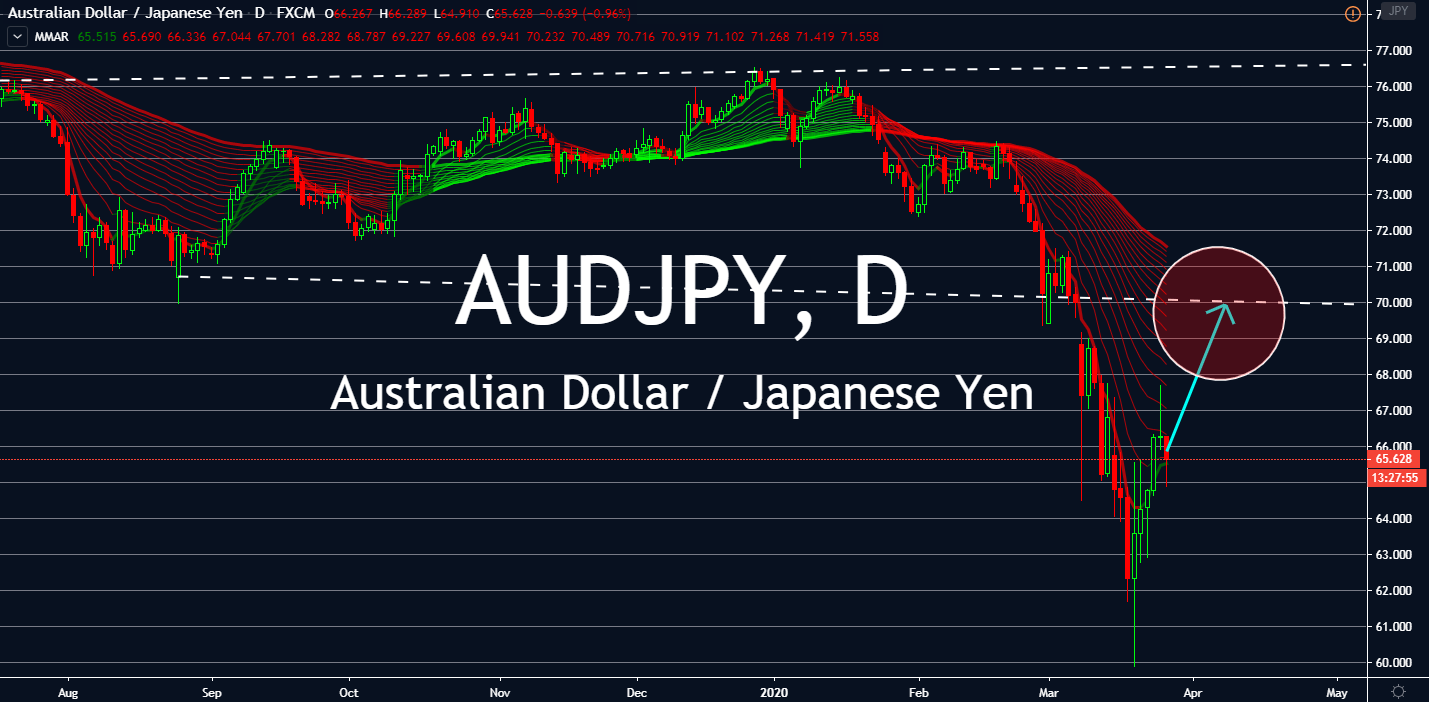
AUDJPY
Needless to say, the AUDJPY pair has had quite a volatile experience these past few months. The aussie began to experience consecutive losses against the yen when the Organization of the Petroleum Exporting Countries slowly sunk into its oil supply war, driving the pair back and forth with more losses than gains. These days, however, the pair is showing signs of slowly coming back to its previous support. While the pair is still expected to see a volatile market in coming days, the AUD might find support once again, especially after Australia’s oil and gas sector can now operate more sufficiently therefore helping with the nation’s economic recovery. The Productivity Commission reported regulatory reforms that could help boost export revenue. Meanwhile, the Bank of Japan pledged to buy risky assets such as ETFs at double its current pace. For now, it seems like the pair’s main driver will be how Australia’s efforts will take effect.
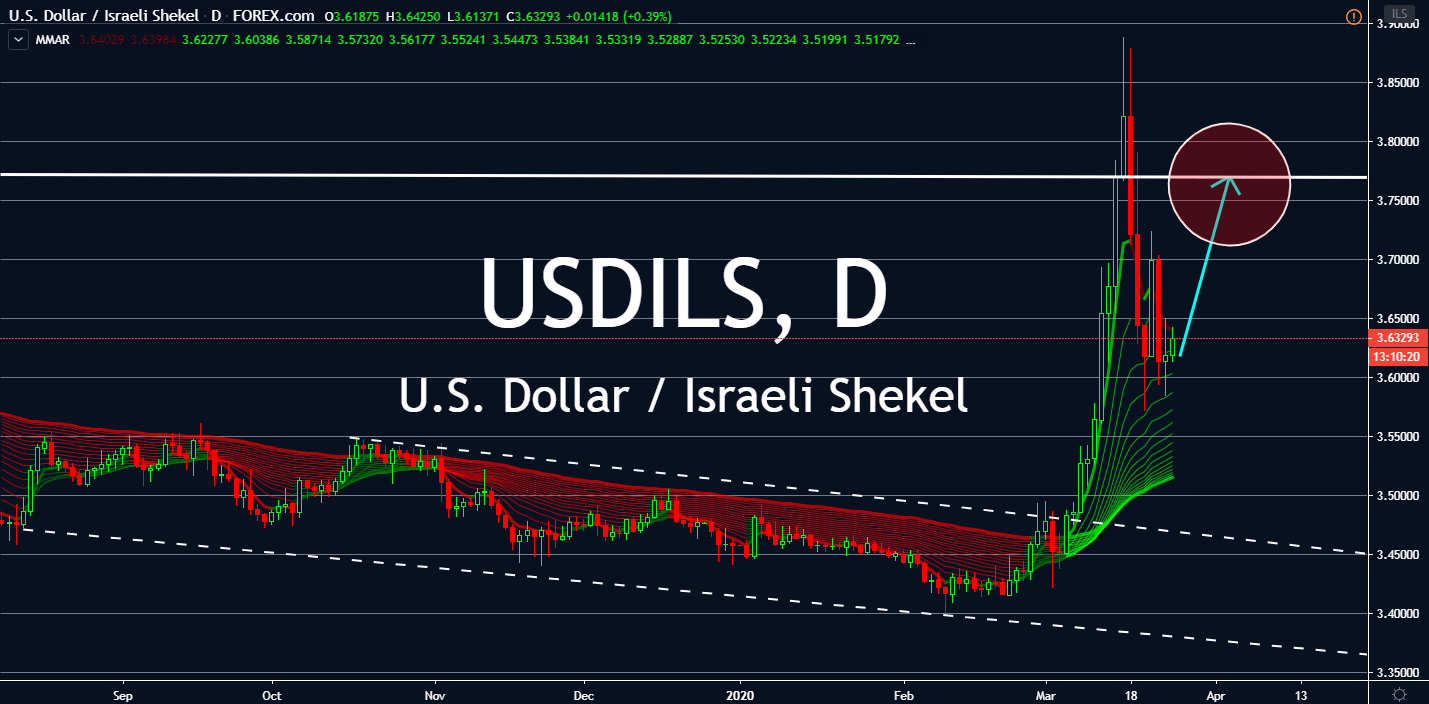
USDILS
After facing tight, slightly bearish support and resistance levels since early August, the US dollar began to surge against the Israeli shekel on March 5 to reach back into highs akin to its 2017 levels. Amid the novel coronavirus crisis, even the pair is experiencing high volatility. On March 24, the Bank of Israel announced a devastating prediction: if the pandemic pursues its reign “in a longer-term scenario,” the country could lose 10% of its GDP. Consequently, the central bank promised to buy 50 billion shekels ($13 billion) in government bonds to ramp up its local economy. Meanwhile, the US Federal Reserve’s decision to buy government bonds at an unlimited amount will undoubtedly rattle the financial markets at a panic-inducing time. The US government just launched a $2 trillion stimulus package to help local businesses. The pair is expected to tread outside its previous pattern until the coronavirus crisis subsides.
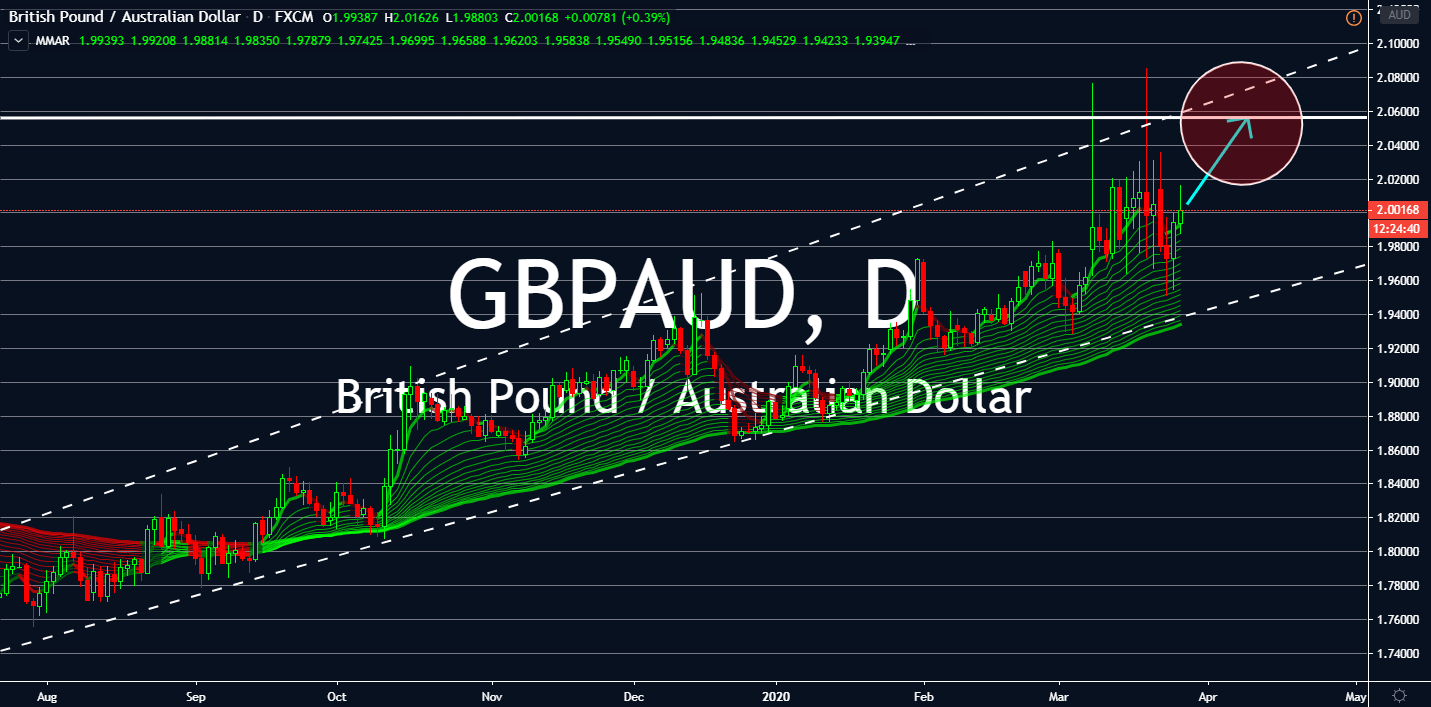
GBPAUD
Amid the surprising volatility in financial markets, GBPAUD is one of the few pairs that showed consistently bullish markets since last year. The British Pound is still expected to follow through, although it might find more volatility after the Bank of England’s interest rate decision after its first cut to an all-time low to 0.10% addition to a quantitative easing stimulus package launched last week. Meanwhile, the Productivity Commission in Australia reported regulatory forms to allow the country’s oil and gas sector to operate smoothly and sufficiently, which could possibly provide the foundation it needs to boost its economy: highly skilled jobs, sustainable energy for sustainable homes and businesses, and export revenue. Despite the strong movement from Australia, the GBP is gaining immense strength against a basket of its rivals, which increases its chance of playing with the bulls if its aggression proves its effectiveness in the UK economy.
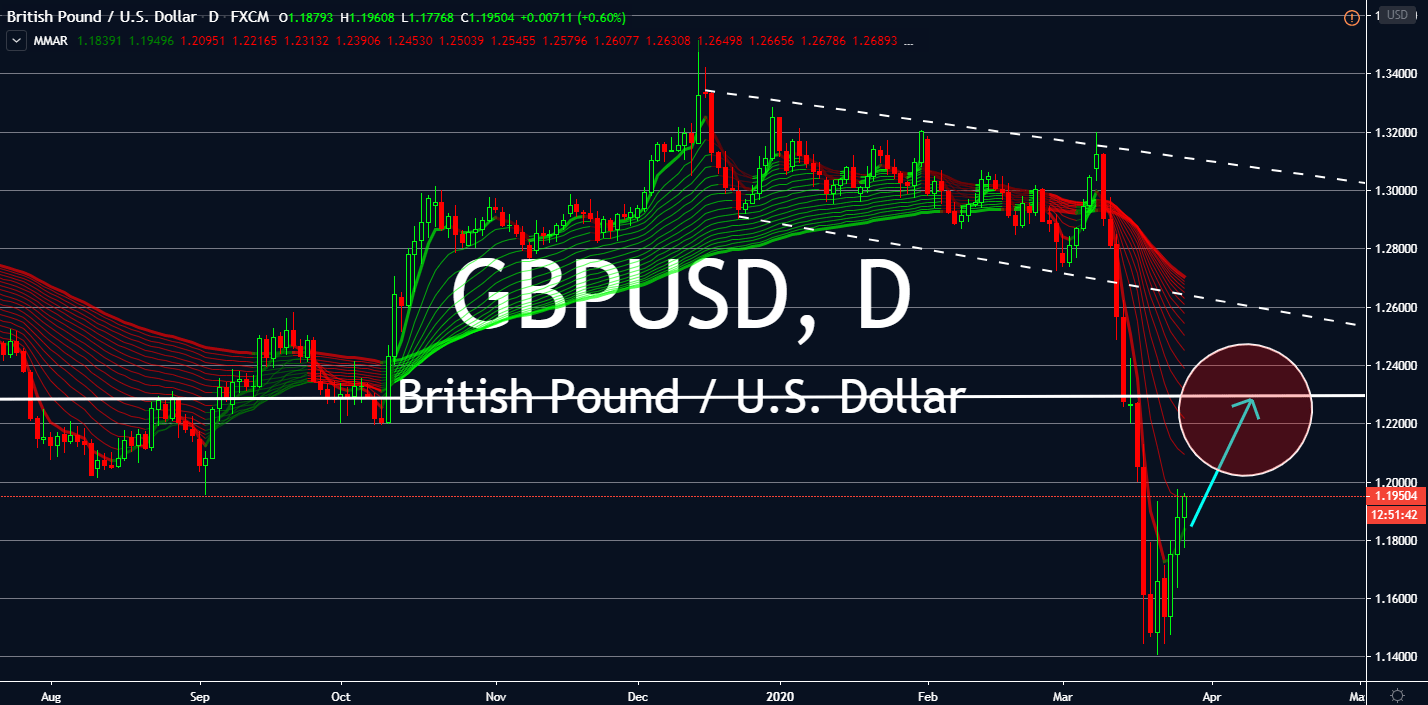
GBPUSD
Although the US Federal Reserve finally woke up the markets to make aggressive movements against a global recession led by the coronavirus, its decision isn’t the main driver of the GBPUSD pair. The US announced a massive jobless claim increase against expectations, which now plays as a major hindrance to its safe haven status. For the week ending March 14, the claims jumped to a two-year high of 281,000. Now, it looks like the Pound sterling is preparing to gain what it lost across different markets. The Bank of England and Britain’s finance ministry are continuing their coordinated efforts to prevent shutdowns due to the coronavirus, especially those that can trigger a long and deep recession in the UK. The markets are now waiting for the BoE’s interest rate cut into what could be another all-time low on top of its first cut into 0.10% last week. Panicking markets will lead the GBPUSD into a volatile pace on its way back to its previous support levels.