Good day traders! Check now the most recent charts and market updates for today’s session. Learn more about analysis and be updated on the current happenings in the market!
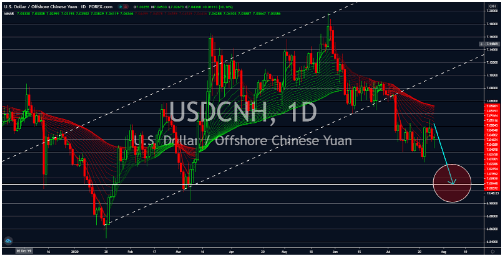
USDCNH
The mixed results from the United States and the possibility of another stimulus package from the government will take a toll on the US dollar. On Thursday, July 23, the US surprised investors after the consecutive decline in the US jobless claims ended. Figures climbed to 1,416K from 1,300K in the prior week, which indicates that the world’s largest economy will not have a robust recovery as expected. Its Manufacturing, Services, and Composite reports from Friday were also a disappointment. Figures came in at 51.3 points, 49.6 points, and 50.0 points respectively. An economic expansion in a certain industry is achieved by posting figures above the 50 points mark. On the other hand, below 50 points indicate that a specific industry is contracting. The central government is also planning to inject another $1 trillion stimuli into the local economy. Meanwhile, China saw an 11.50% growth on its Industrial Profit YoY report.
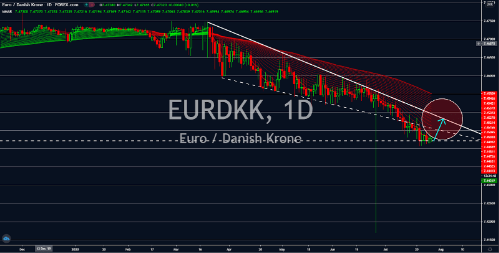
EURDKK
Investors became optimistic as Germany, the EU’s economic powerhouse, posted positive results for its Business Expectations and Business Climate Index reports. Both reports beat expectations and their prior records after posting figures of 97.0 and 90.5 points, respectively. Aside from that, the second-largest economy in Europe, France, posted the lowest number of job seekers since the month of May at 3,964.7K. During the height of the pandemic, analysts gave these two (2) economies bad ratings and forecasted them to decline by 6.7% and 13.0%, respectively. However, these positive figures from recent reports might cause a revision in the outlook. Another country that is experiencing a modest recovery in Europe is Denmark. Yesterday, July 27, the country posted 6.6% growth on its retail sales report, higher than its previous record of 5.2%. However, investors are expecting more from the country given that it was not hit the hardest by COVID-19.
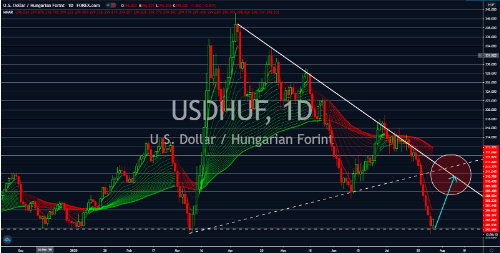
USDHUF
The revised outlook for the Hungarian economic growth will help the pair recover from its recent low. FM Mihaly Varga delivered a speech on the state radio last Thursday, July 23. According to the minister, the government is now expecting a deeper impact of the coronavirus pandemic in the country’s economy. Expectations were low at -5.0%, up from -3.0% prior. However, analysts are looking for gloomier 2020 GDP data. This was following the 30.7% decline in the country’s industrial output for the month of May. The month of April holds the current record of the biggest decline for the said report at -36.8%. Just like Hungary, the United States also had several revisions on the country’s economic outlook for the fiscal year. The most recent was from the Fitch rating agency. For the year 2020 to 2025, the credit rating agency downgraded the US potential growth to 1.4% from 1.9%. However, this is more modest compared to Hungary.
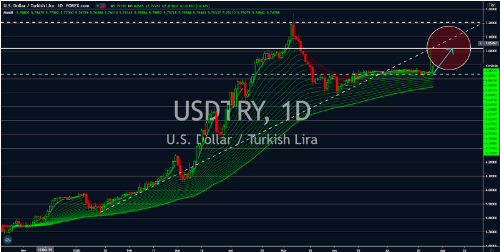
USDTRY
Turkey’s high lending rate might hurt the country’s economy in the short to medium term. Figure from last Thursday’s report was recorded at 9.75%. Meanwhile, its borrowing rate was lower at 6.75%. The need for liquidity for the country’s twelve (12) months debt obligations is high as these debts were way higher than the country’s capacity to pay them. And the high lending rate is starving Hungary of possible cash to pay these debts. Investors were also still pessimistic in today’s trading session despite the Fitch rating agency reaffirming the country’s investment-grade and outlook at B+/B’ foreign-currency and ‘BB-/B’ local-currency sovereign credit ratings and a stable outlook in the next twelve (12) months. This pessimism from investors will ultimately lead to the sell-off of the Turkish lira in the coming weeks. The US, on the other hand, also had disappointing reports last week. However, investors are taking advantage of the weak USD and buying them up.