Good day traders! Check now the most recent charts and market updates for today’s session. Learn more about analysis and be up to date on the current happenings in the market!
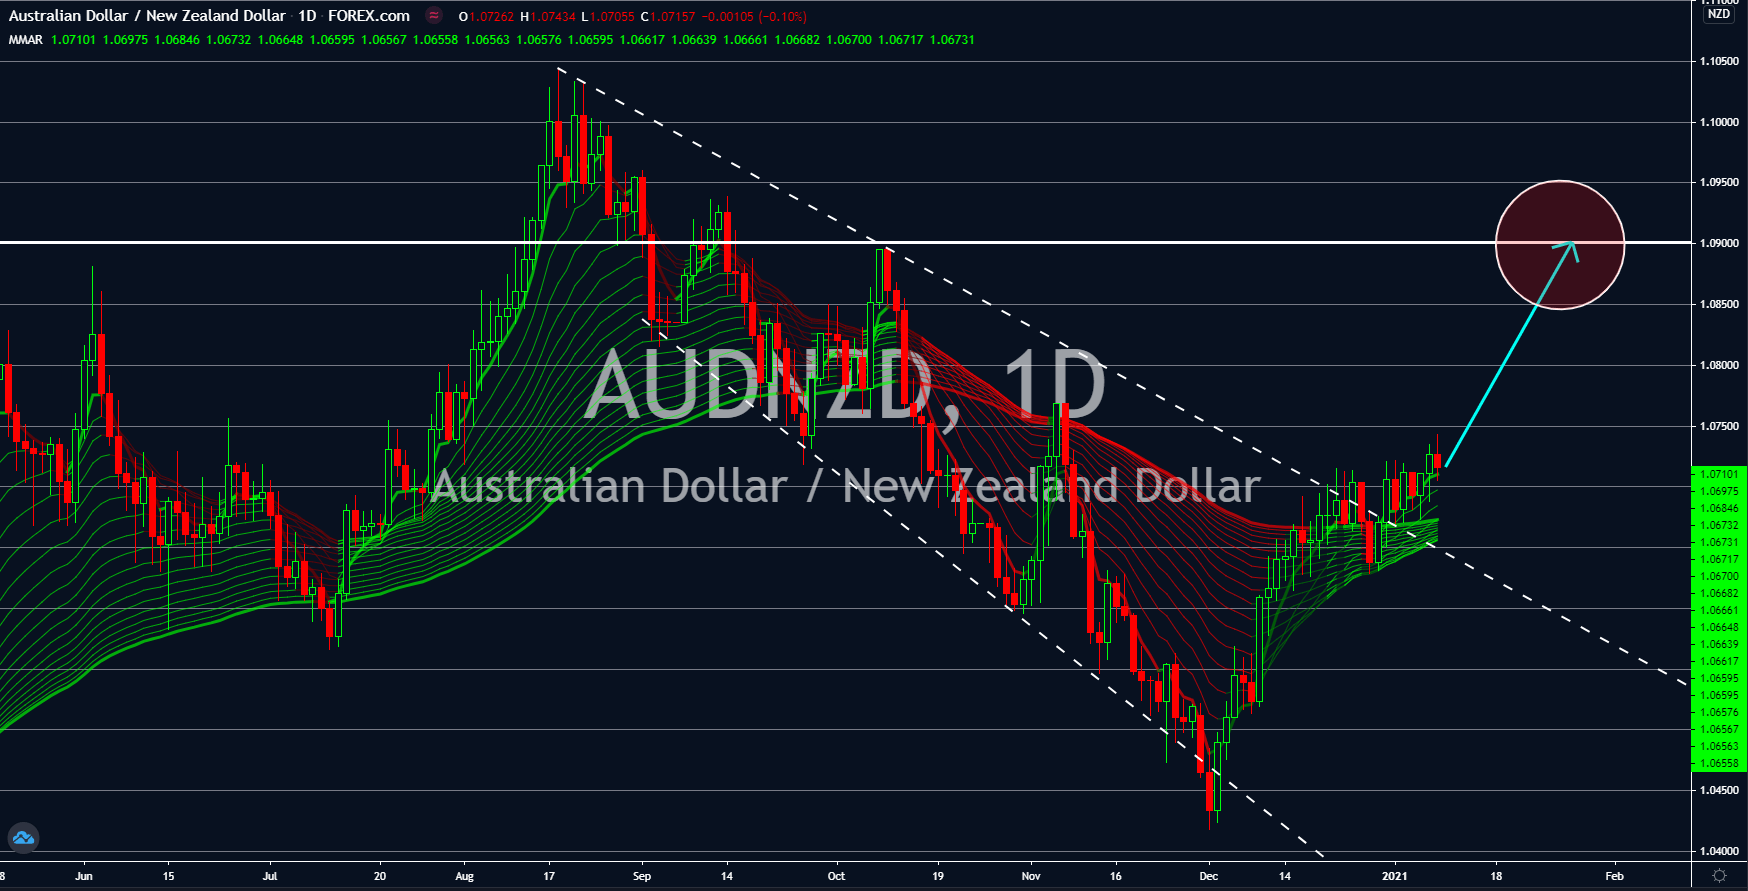
AUDNZD
The Australian dollar is gaining some traction against its counterpart in New Zealand. Since December, the AUDNZD has been trading higher. It eventually broke out of the downtrend resistance line in 2021. The pair is now up by 2.81% from December 01’s low to date. The upbeat performance of the AUD was due to the better-than-expected results from its reports. This week’s main driver was the Retail Sales report for the month of November. The figure came in at 7.1% against 7.0% expectations. This month’s result was also a huge improvement from 1.4% data prior. This was the highest recorded figure for the last five (5) months. While New Zealand’s economy also outperforms the global market, investors are sceptical to expose themselves to the kiwi currency due to a lack of recent reports from the country. Hence, it is safe to say that investors will prefer assets on which they have access to recent information.
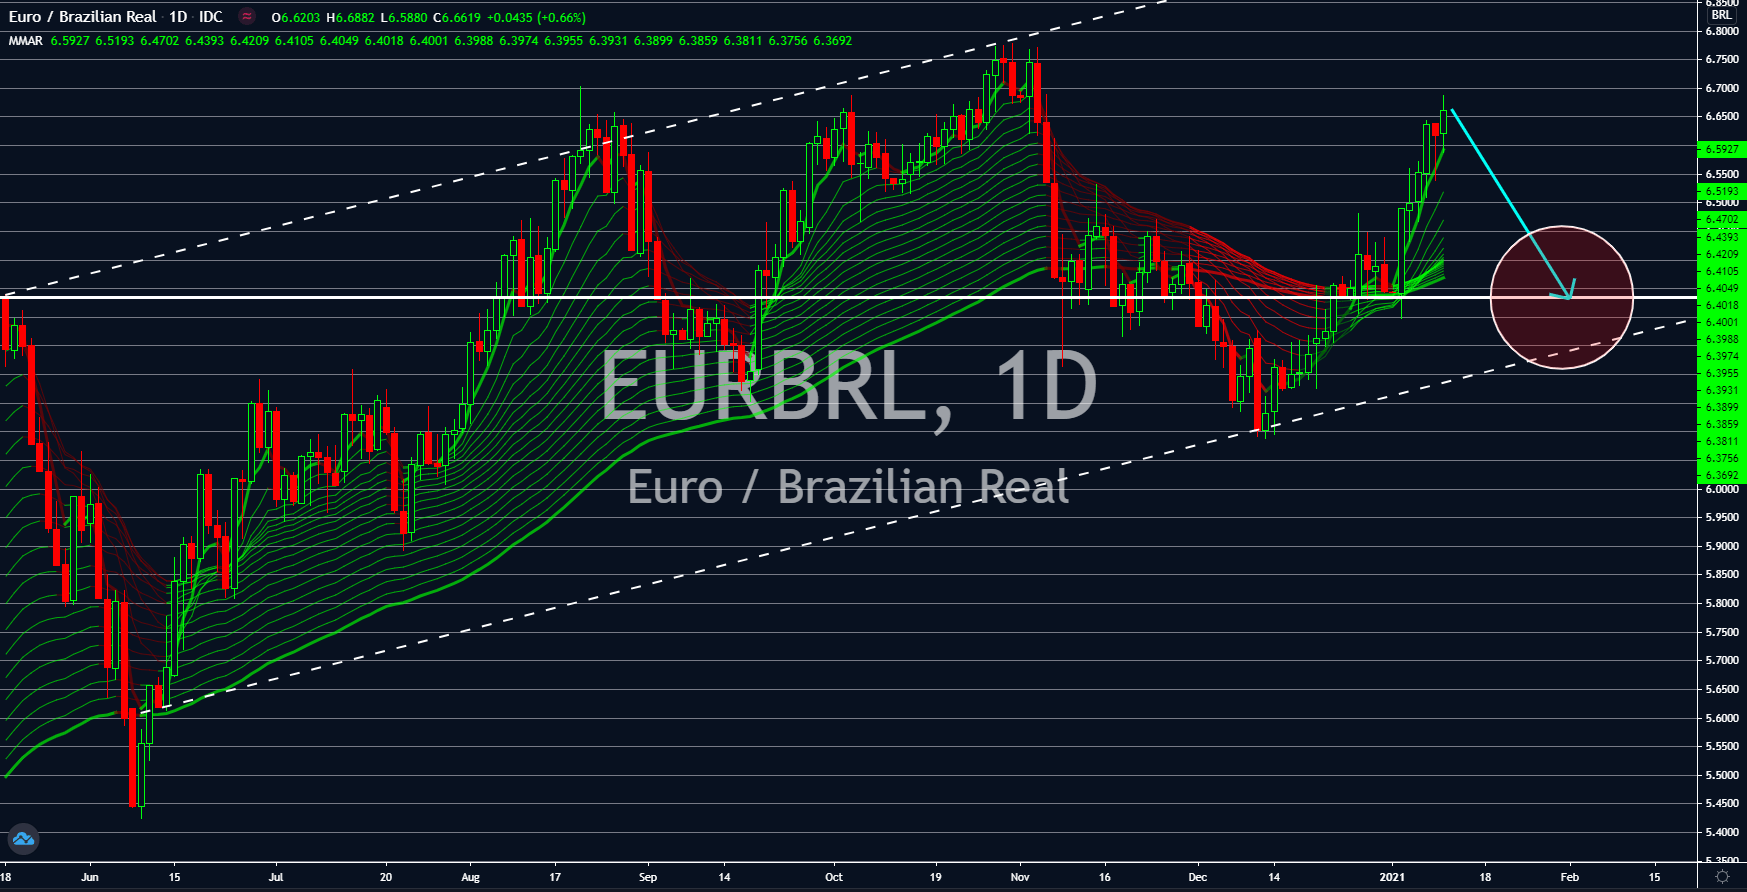
EURBRL
Brazil Industrial Production report grew by 1.2% for the month of November, higher than the previous record of 1.1%. Meanwhile, the report grew by 2.8% on an annual basis, which suggests the continued recovery in South America’s largest economy. The gradual reopening of Brazil’s economy showed auto production in the last month of 2020 surging by 12.1%. In November, it had a record of 0.7% growth. This was the highest reported figure since the 23.6% jump in August’s data. This strong figure led to an 8.4% increase in auto sales for the reported month. Another key factor for Brazil’s strong recovery was the surge in soybean prices. The high demand for the commodity was due to dry weather in South America along with high export restrictions in Russia. Moscow imposed 30% duty on soybean for exports, but not lower than $202.00 per ton. The levy will start in mid-February until July 2021.
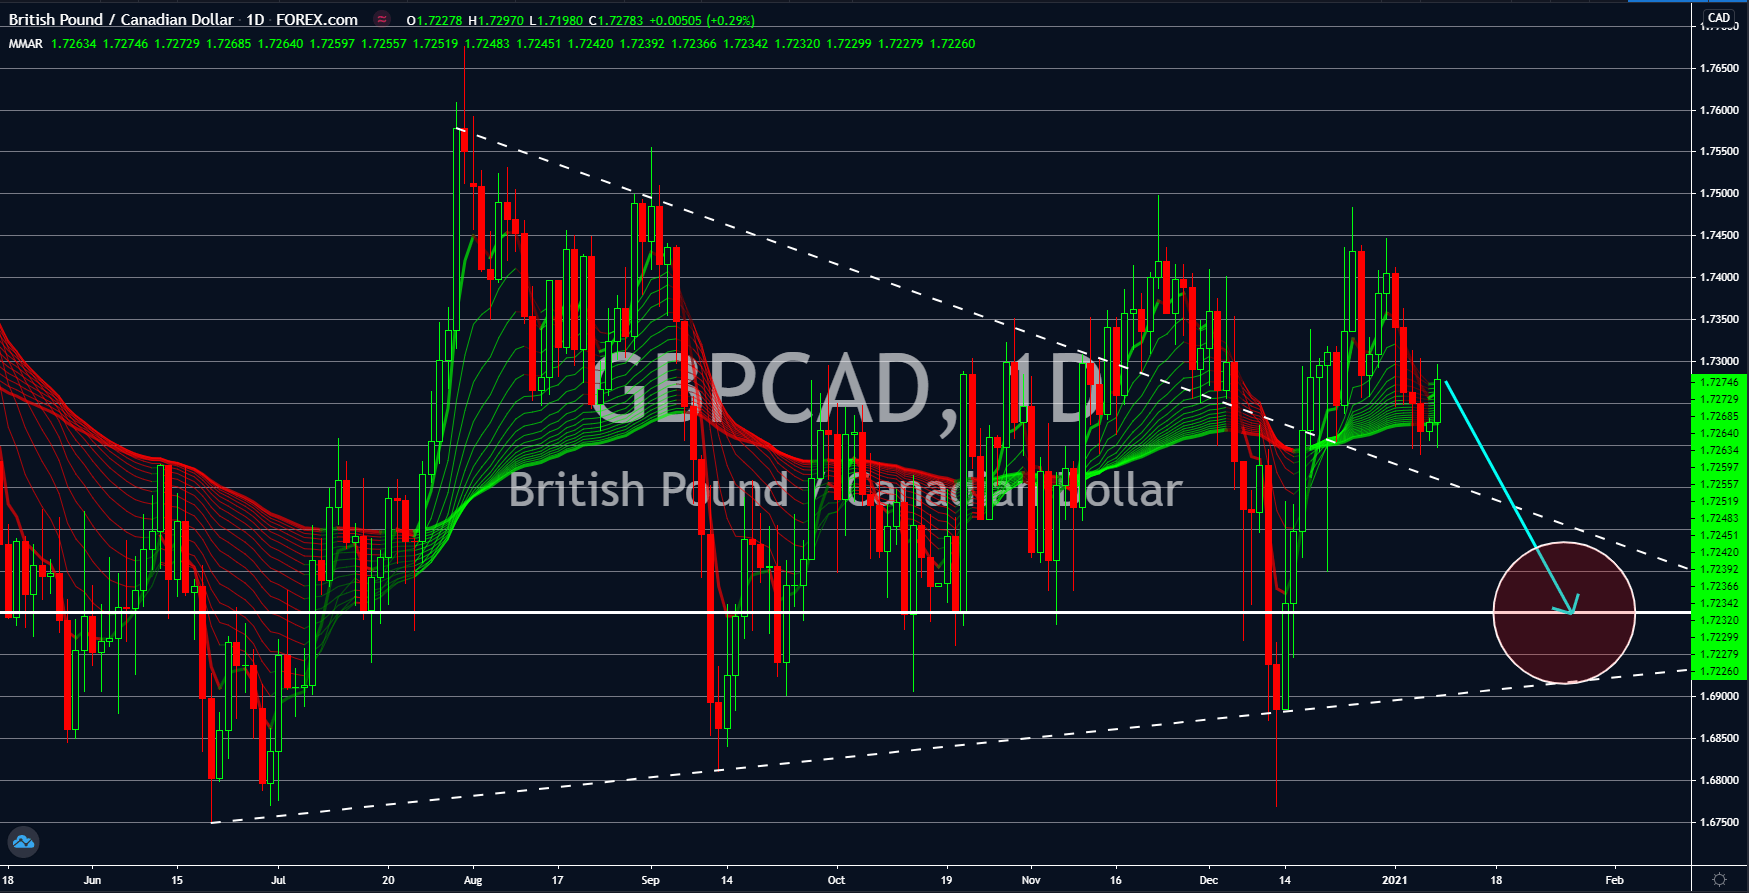
GBPCAD
Canada’s trade deficit declined from -3.73 billion in October to -3.34 billion in the succeeding month. This positive report was due to the slowdown in Canadian imports to 50.10 billion. Meanwhile, exports advanced to 46.76 billion. The high export data is positive for the Canadian dollar as it shows the increased economic activity in the country. Meanwhile, the UK is facing a major hurdle in COVID-19 cases. The country surpassed the 3 million mark on Friday, January 08, after reporting record-breaking daily coronavirus infections by more than 60,000 fresh cases. The culprit behind the massive increase was the new variant of COVID-19, which was 70% more contagious. Meanwhile, Prime Minister Boris Johnson has already ordered a nationwide lockdown in the UK. The third lockdown is expected to take a toll on Europe’s second-largest economy. Analysts are expecting new stimulus from the government to keep the economy afloat.
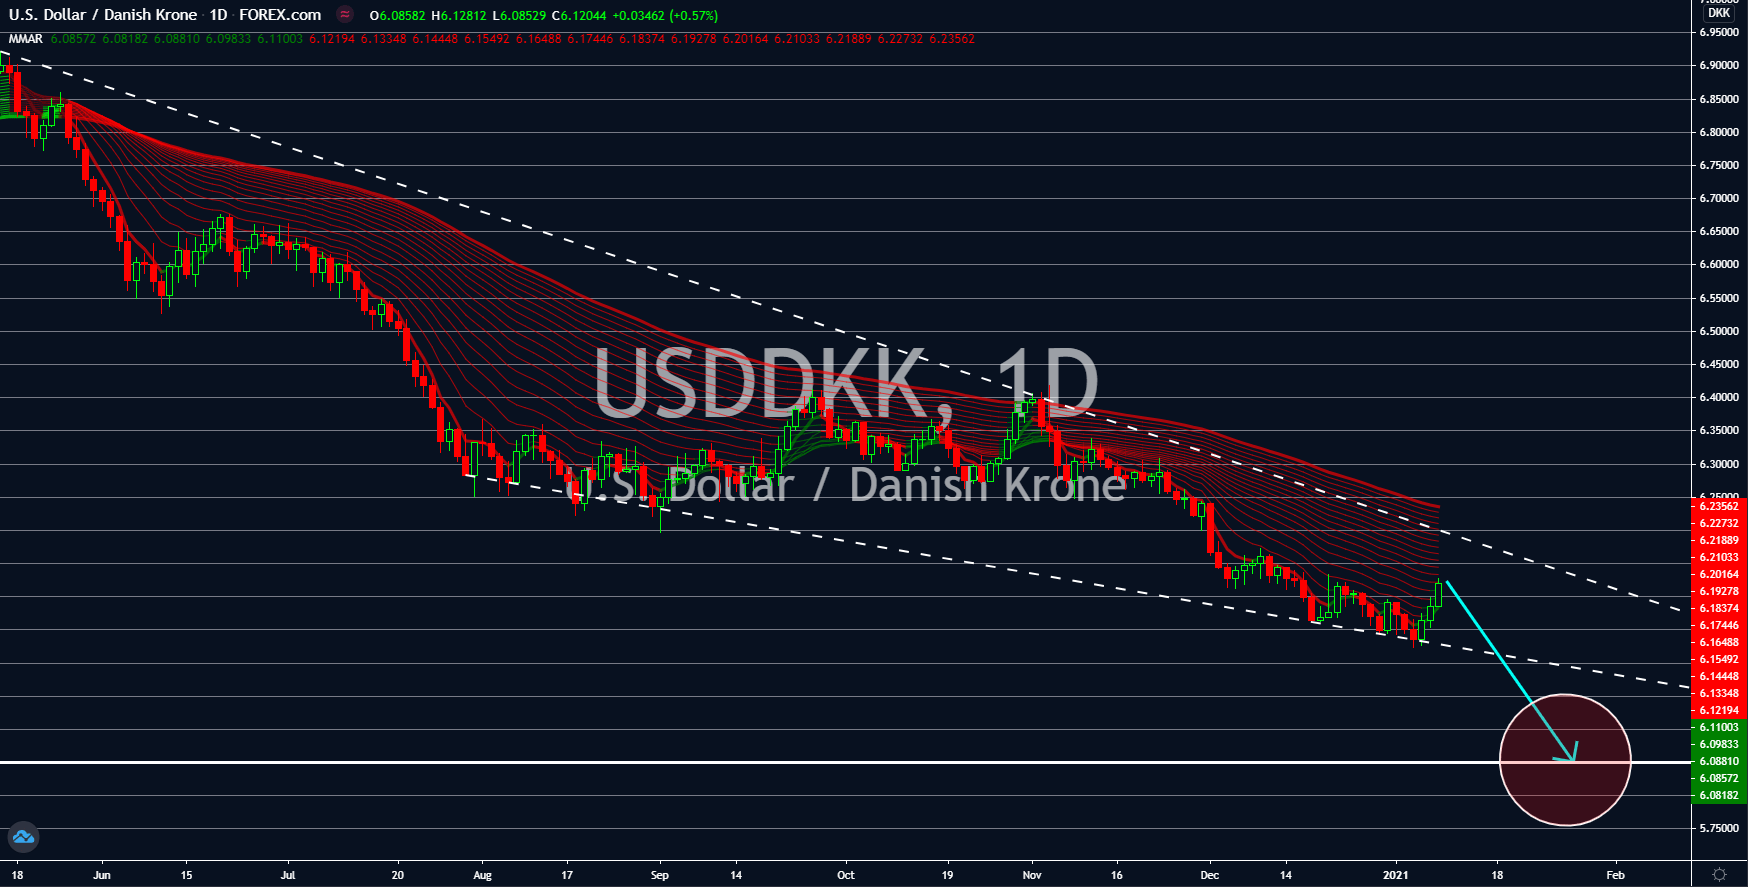
USDDKK
Denmark posted impressive results last week. The country’s unemployment rate declined to 4.0% in November, the lowest in 8 months. Meanwhile, the prior record was 4.1%. In addition to this, the Industrial Production report rose from the negative territory with 5.9% growth. Its October result was -5.6%. On the other hand, the US labour market continues to struggle amid the resurgence of COVID-19 in the country. As a result, the US government is pressured to inject more stimulus into the local economy. Currently, around $6.6 trillion in economic aid was already released by the government. The US Congress is yet to approve raising stimulus checks from $600.00 to $2,000.00. There is already $900 billion allocated for the stimulus checks. President-elect Joe Biden backed the $2,000.00 check and promised to inject trillions of dollars in stimulus once he is sworn in the office. The inauguration will take place on January 20.