Good day traders! Check now the most recent charts and market updates for today’s session. Learn more about analysis and be updated on the current happenings in the market!
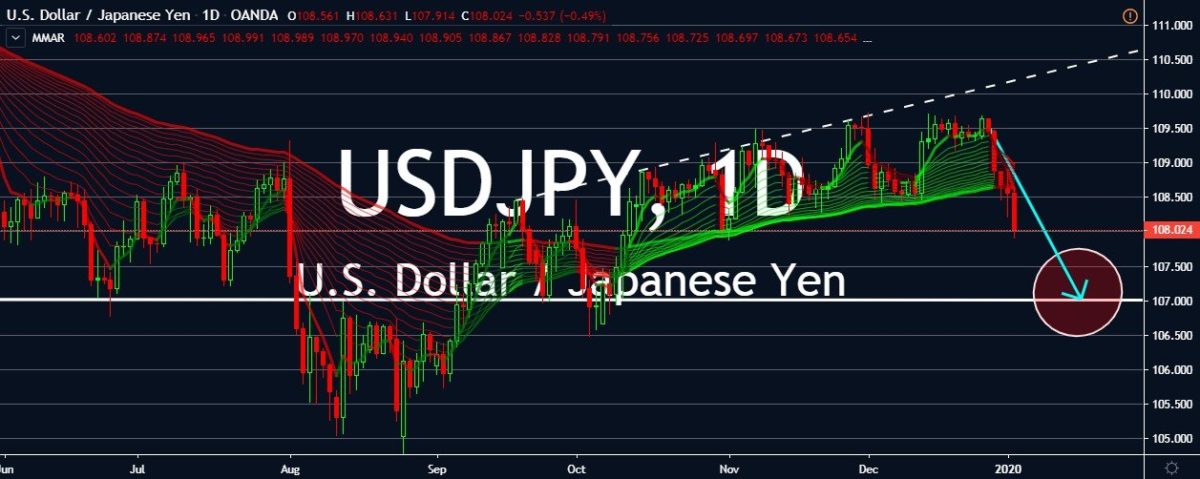
USDJPY
The US dollar sunk against the Japanese yen in today’s trading as tensions between the United States and Iran rises. The recent events in the Middle East caused the safe-haven appeal of the yen to glow even brighter, attracting traders who are worried about the tension and possible escalations. Earlier today, an airstrike in Baghdad International Airport took down two important and powerful officials from Iran and Iraq. Then, Iran’s Supreme Leader Ayatollah Ali Khamenei vowed to make harsh retaliation against the United States for the attack. The death of the Iranian and Iraqi officials fueled rage across Tehran, and the government declared three days of mourning for their deaths. Immediately after that, the Japanese yen floored its gas pedals in trading sessions and brought down all major currencies including the US dollar. But to be fair, the US dollar is also a safe-haven asset, but the Japanese yen shined brighter and came out stronger.
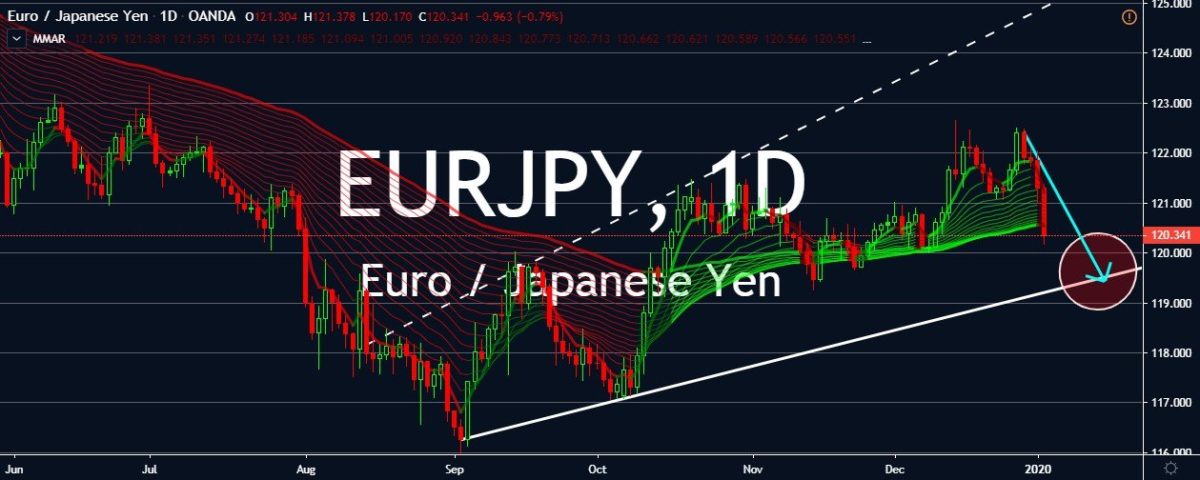
EURJPY
The odds aren’t looking good for EURJPY bulls in trading sessions. The pair is in for downhill run in the coming sessions as the Japanese yen continues to gain attention thanks to the rising tension in the Middle East. On top of that, the poor German data are making it harder for the bloc’s single currency. Earlier, the December unemployment change in Germany was released by Destatis. According to the report, Germany’s unemployment change jumped from -16K to 8K in December, going way beyond expectations of 2k increase. The massive climb hurt the euro. Aside from that, the German unemployment n.s.a. rose from 2.180 million to 2.227 million. The unfortunate results will, of course, not stand a chance against the Japanese yen’s safe-haven appeal now that the tension in the Middle East is scorching hot. Traders are worried about what the Iranian Supreme Leader meant when he said that there will be harsh retaliations.
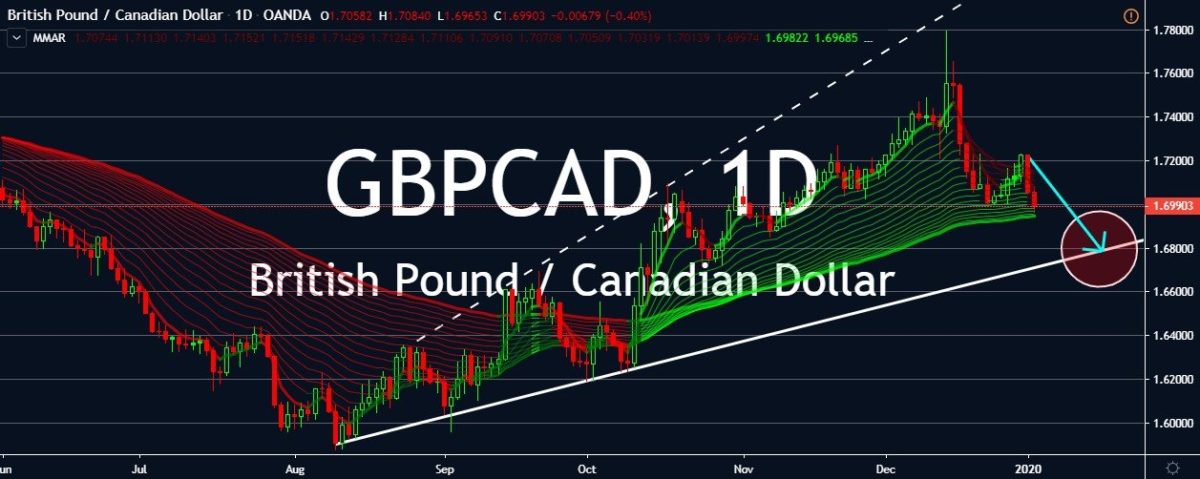
GBPCAD
As the official signing ceremony of the United States and China trade war draws near, the Canadian dollar is benefiting from the improving sentiment. The Canadian dollar is looking to continue the bearish momentum for the GBPCAD in trading sessions, especially during this time when bulls are cautiously moving amid Brexit concerns. The CAD is obviously not relying on economic reports as the only results from Canada’s economy was the disappointing RBC manufacturing PMI for December that was released earlier this week. Canada’s factory activity dropped from 51.4% to 50.4% last month, surprising the markets who expected an improvement to 51.9%. Meanwhile, in the United Kingdom, the contractions shown in reports about Britain’s economic activities also added pressure on the pound. The UK’s December construction PMI results declined from 45.3% to 44.4%. And the BoE’s November consumer credit fell from 1.339 billion to 0.563 billion.
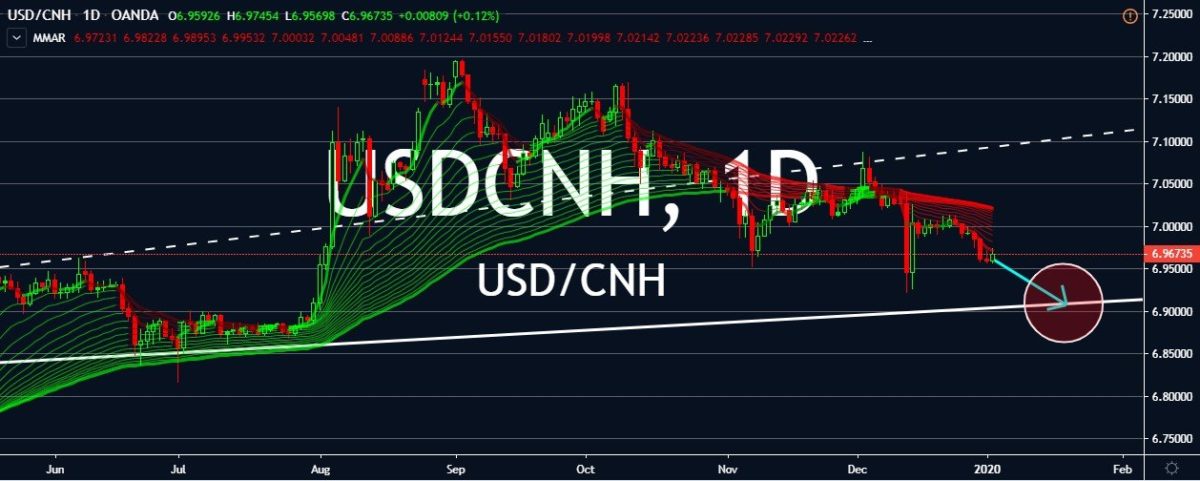
USDCNH
The pair is struggling to find a clear direction and its movements have been limited since the last few weeks of December. As of the moment, efforts of the People’s Bank of China to buoy the struggling economy of the country if failing to buoy the Chinese yuan who is struggling to gain against the US dollar in today’s trading. But soon, the pair is expected to gradually inch downward as the relationship between the two economic giants starts to improve. Then, recently, the Chinese central bank announced that it will be trimming down its required reserve ratio for banks across China. The move will inject billions of billions of funds in the country’s financial system and is aimed to help the cash-struggling businesses in the country. The move from the PBOC was already widely expected by the market as high-level officials from Beijing has previously promised it and encourage banks to do so. It also comes in a great time as China’s economy looks for recovery.