Good day traders! Check now the most recent charts and market updates for today’s session. Learn more about analysis and be updated on the current happenings in the market!
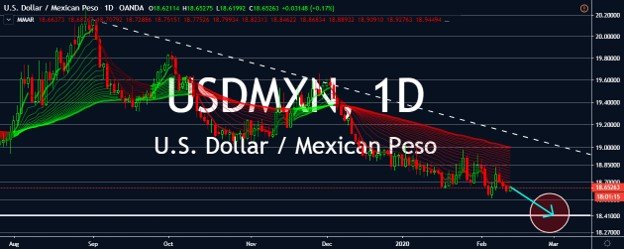
USDMXN
The US dollar is on the defensive against the Mexican peso in the foreign exchange scene. The safe-haven appeal of the greenback amidst the novel coronavirus is barely working against the Mexican peso. Bears are brushing off the weak inflation results from the Mexican economy and are determined to continue pulling the pair down to its support levels. The USDMXN pair is widely expected to drop down to its support by the end of the month or perhaps by the first few days of March. However, things could change and get difficult for the Mexican dollar as later today, as the Banco de Mexico is scheduled to announce its official interest rates for the second month of 2020. Experts believe that the Mexican central bank is most likely to ease its interest rates by 0.25 basis points, from 7.25% prior to 7.00%. If that would be the case, the Mexican peso’s momentum might falter, which could result in a slower decline for the pair.
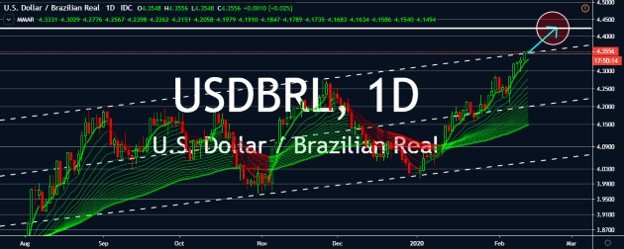
USDBRL
The Brazilian real is on loads and loads of trouble against the US dollar. The USDBRL recently reached new highs in sessions, and it’s still believed to continue its uphill climb in sessions as the Brazilian real runs its weakest performance against the buck. Unfortunately for the real, the contraction in the country’s retail sales figures from December strained its remaining fighting power, causing the pair to surge. Official data from Brazil shows that its monthly retail sales dropped from 0.7% prior to -0.1%, falling further from the projected 0.2%. Investors were immediately concerned and bothered by the health of the Brazilian economy and the real, paving the way for bulls to advance. The Brazilian retail sales results recorded its first decline in about eight (8) months, disappointing experts and policy makers. Just last week, the Brazilian central bank eased its benchmark Selic to new lows at 4.25% in efforts to buoy the economy.
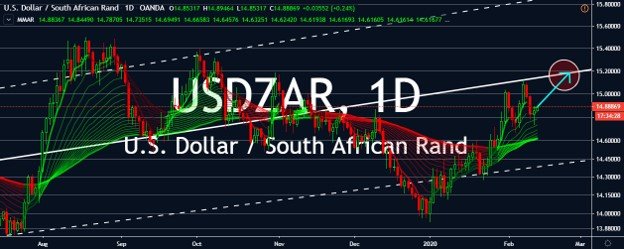
USDZAR
The negative figures produced by the South African economy is giving way for the bulls to hold on to their upward trajectory in sessions. With economic results weighing on the South African rand, the pair will most likely reach its resistance level by the latter half of the month. Earlier this week, South Africa reported that its unemployment rate for the fourth quarter of the year remained stagnant at 29.10% or at approximately 6.700 million. Then, the country’s December manufacturing production unexpectedly contracted, recording a drop from -1.5% to -2.8%, alarming experts who projected a slight improvement to -0.7%. On top of that, yesterday, the country’s annual retail sales figures from December collapsed from 2.6% to -0.4%, plunging deeper from expectations of an 1.5% outcome. Later today, bulls are expecting support from the US core consumer price index results which is expected to show gradual improvements.
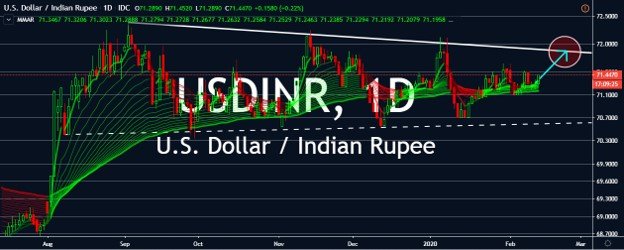
USDINR
Investors are having difficulty pulling the pair higher or lower in sessions. Still, the USDINR pair is expected to climb to its resistance by late February. The improvements in India’s annual consumer price index for January reportedly rose from 7.35% prior to 7.59%, topping forecast of 7.40%. Meanwhile, the country’s annual industrial production for December unexpectedly dropped, catching investors off guard as it recorded a fall from 1.8% to -0.3%. The Indian rupee is seen struggling to gain ground ahead of the country’s WPI inflation results for January which is expected to show gradual improvements. Meanwhile, the US dollar is waiting for further support that could push the pair higher later today. The United States’ core consumer price index for January is scheduled to be released today and it is widely expected to record slight improvements. Aside from that, the US continuing jobless claims and initial jobless claims are also scheduled.