Good day traders! Check now the most recent charts and market updates for today’s session. Learn more about analysis and be updated on the current happenings in the market!
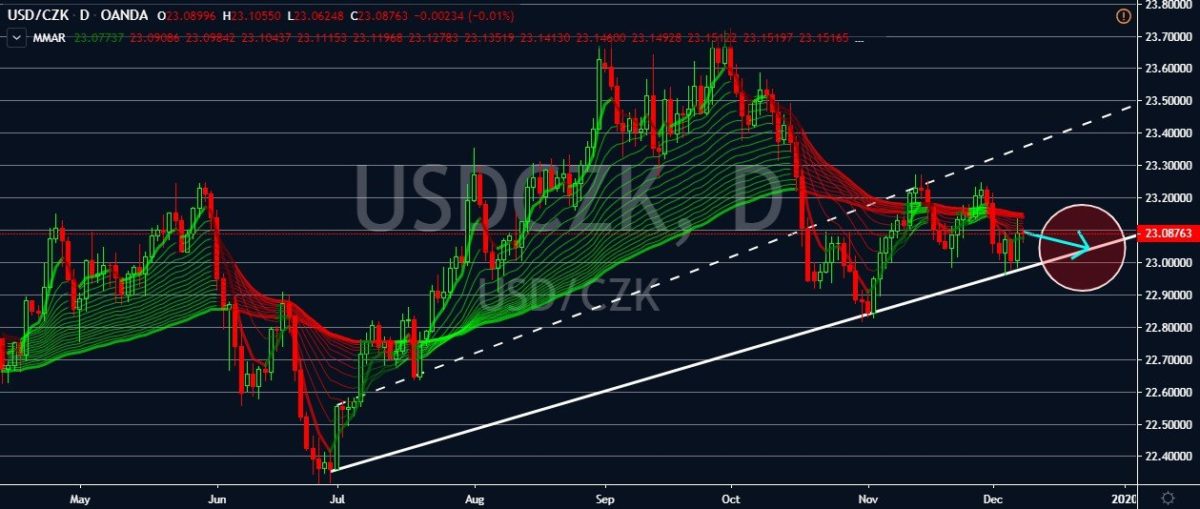
USDCZK
Trump’s tariff war against China may have not spilled over the broader economy of the United States, but it’s still restricting the US dollar in sessions. The greenback has continuously taken hits from trade war news, and with December 15 just right around the corner, traders are carefully weighing and cautiously moving, resulting in a week performance from the buck. Last Friday, the US dollar gained traction thanks to the improvement in the US nonfarm payroll, but the effect is wearing off this Monday, causing the pair to start slipping. The pair is projected to hit its support soon and it’s widely expected that there won’t be any wild jump from the pair anytime soon. Anyhow, the pair is expected to break through its support level if Trump imposes the tariffs on Sunday next week. Still, without the greenback’s weakness, traders doubt whether the Czech koruna has fuel to floor the pair lower after its slow wage growth report earlier this month.
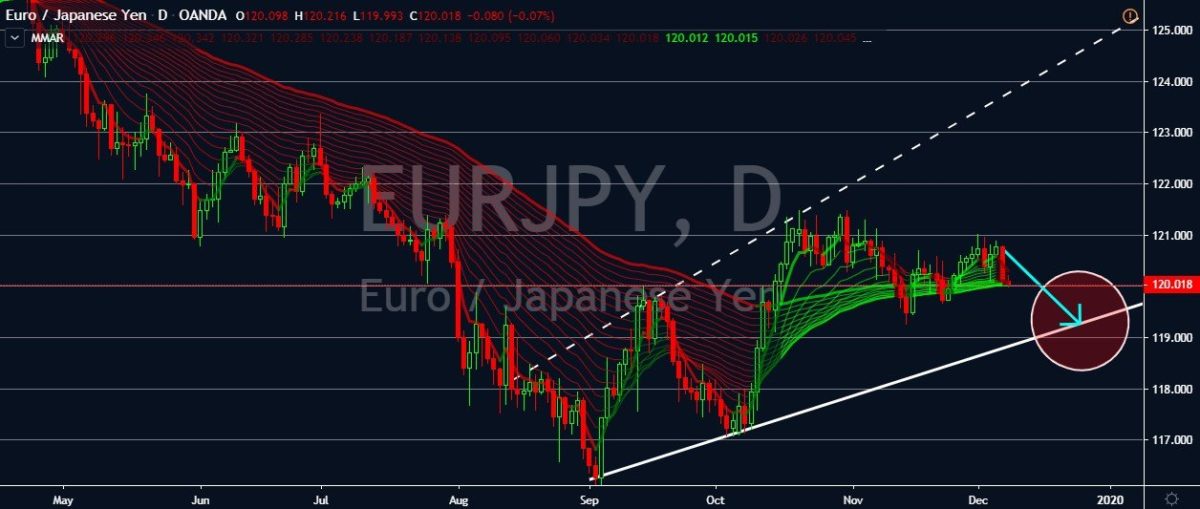
EURJPY
The US president’s trade war isn’t only affecting the dollar, it’s also boosting the safe-haven appeal of the Japanese yen. And with the impressive figures from the Japanese gross domestic product report, the pair is bound to hit its resistance soon. Just yesterday, the Japanese Cabinet Office released the third quarter GDP report showing a hike from 0.1% to 0.4% on a quarter-over-quarter basis. While on a year-over-year basis, Japan’s gross domestic product went up from 0.2% to 1.8% in the third quarter. Furthermore, Japan’s current account surplus went up from 1.613 trillion yen to 1.817 trillion yen as reported by the country’s Ministry of Finance. So far, the EURJPY pair has avoided sharply plummeting in sessions. However, it is still highly expected to continue moving down towards its support levels as the year closes to an end. As for the euro, traders are still patiently waiting for the ECB’s interest rate decision due this week.
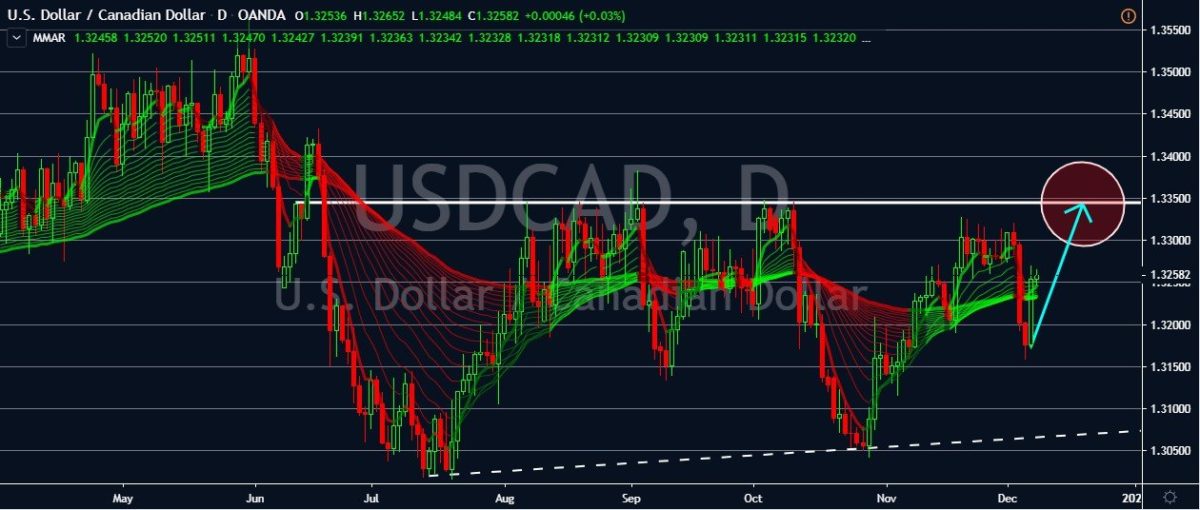
USDCAD
Earlier this month, the Bank of Canada gave a dovish assessment in the global economy and its “robust economy.” However, last Friday’s employment report says otherwise. The USDCAD pair soared through the trading sessions following the optimistic US Nonfarm payroll and the discouraging figures from Canada’s working report. According to Statistics Canada, the country’s employment change nosedived from -1.8k to -71.2k, alarming traders and the government. The country shed about 71,000 jobs just last month, pushing Canada’s unemployment rate up to 5.9%, readings last seen in more than a year. Quebec, British Columbia, and Alberta all had the most losses, and most of them came from the manufacturing sector, public administrations, and natural resources. It mostly affected male workers around the ages of 25 to 54. The data came in bad timing for the loonie as the US jobs data smashed the markets’ projection last Friday.
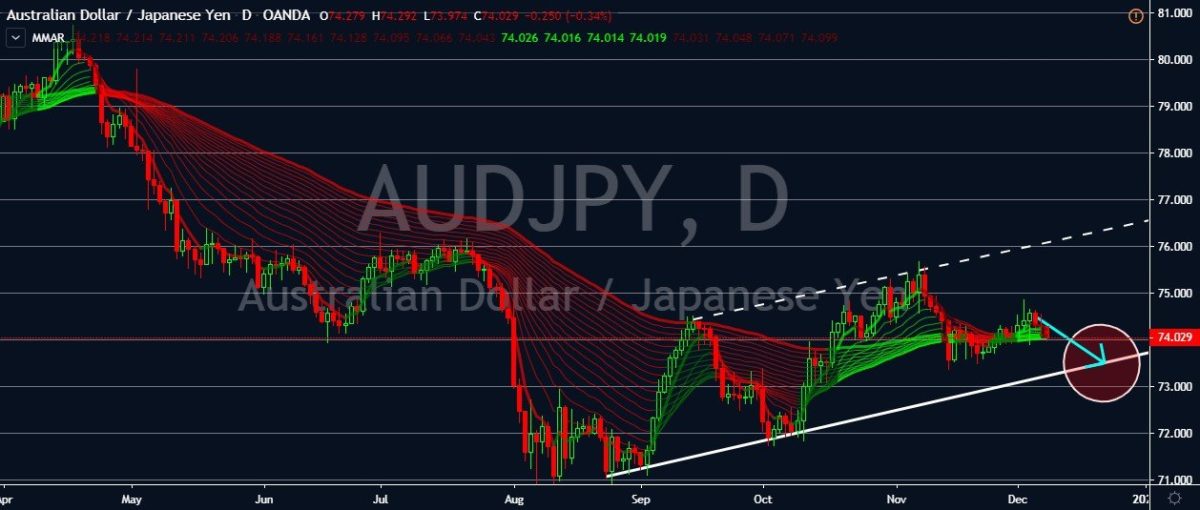
AUDJPY
With soft figures from Australia’s economic activities, the promising results from Japan’s gross domestic product report, and the somewhat never-ending US-China trade war, the Japanese yen is poised to pull the AUDJPY lower in sessions. Midway through last week’s trading, the pair had a reversal following the disheartening Australian retail sales figures. The country’s Bureau of Statistics reported a drop in Australia’s retail sales on a month-over-month basis from 0.2% to 0.0%, unfortunately failing to meet expectations of 0.3% growth. The agency also reported a huge drop in the country’s trade balance in October from AU$7.180 billion to just AU$4.502 billion, falling further from expectations of AU6.100 billion. And as mentioned above, the Japanese GDP broke past expectations on its last reading. And, of course, the yen is also benefiting from the US president’s tariffs and the uncertainties around the whole trade war.