Good day traders! Check now the most recent charts and market updates for today’s session. Learn more about analysis and be updated on the current happenings in the market!
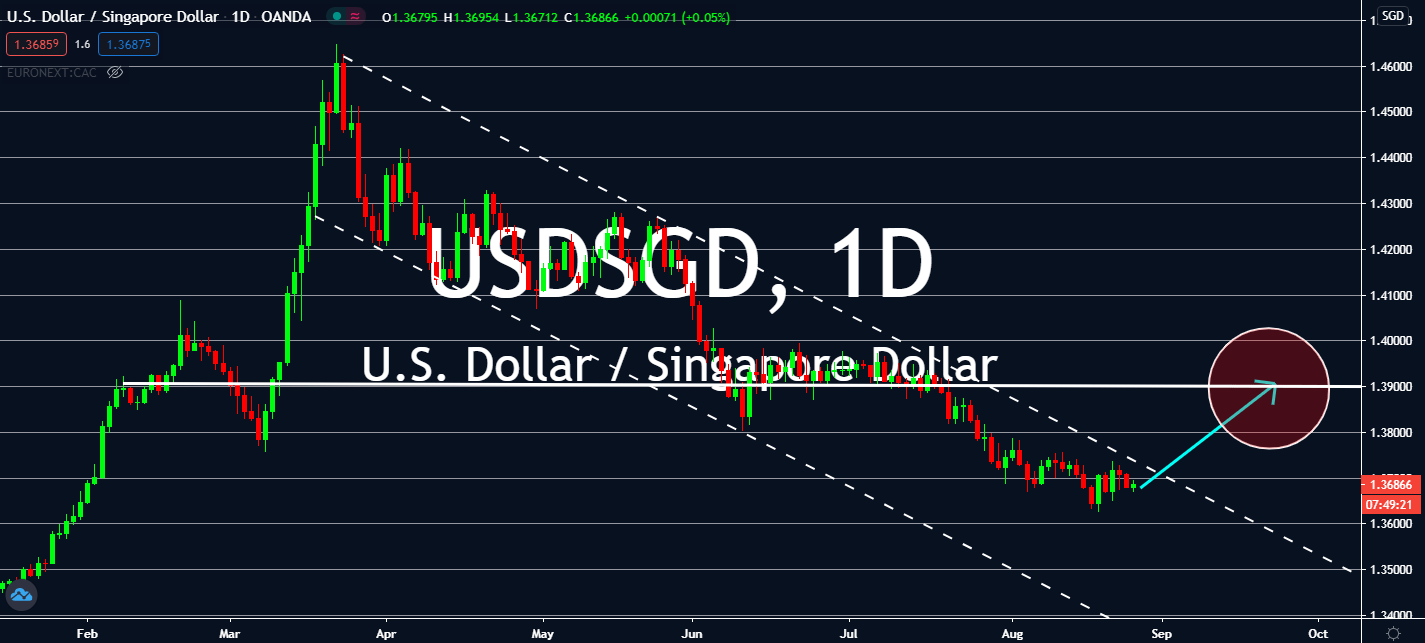
USDSGD
Asian economies have been in center focus in recent trading, but crude oil inventories in the United States did not come to play. Rare double storms in the US forced a decline in crude oil output and declined inventories this week. The US is projected to report more than 2 million fewer barrels in its next report at -3.694 million from -1.632 million recorded prior. Meanwhile, two important economic stimuli in Singapore reported a decline against previous records and market estimates in today’s trading. Industrial production declined much farther than expected in July this year at -8.4%, a fall unforeseen in comparison to the anticipated growth to -5.7% and its record of -6.5% seen last year. Meanwhile, although the same stimulus’ figure projected a shallower growth than anticipated at 1.6%. This disappointed economists, considering that its estimates predicted the monthly climb to step up by 6.0%, way up from the 0.6% figure seen in June.
USDZAR
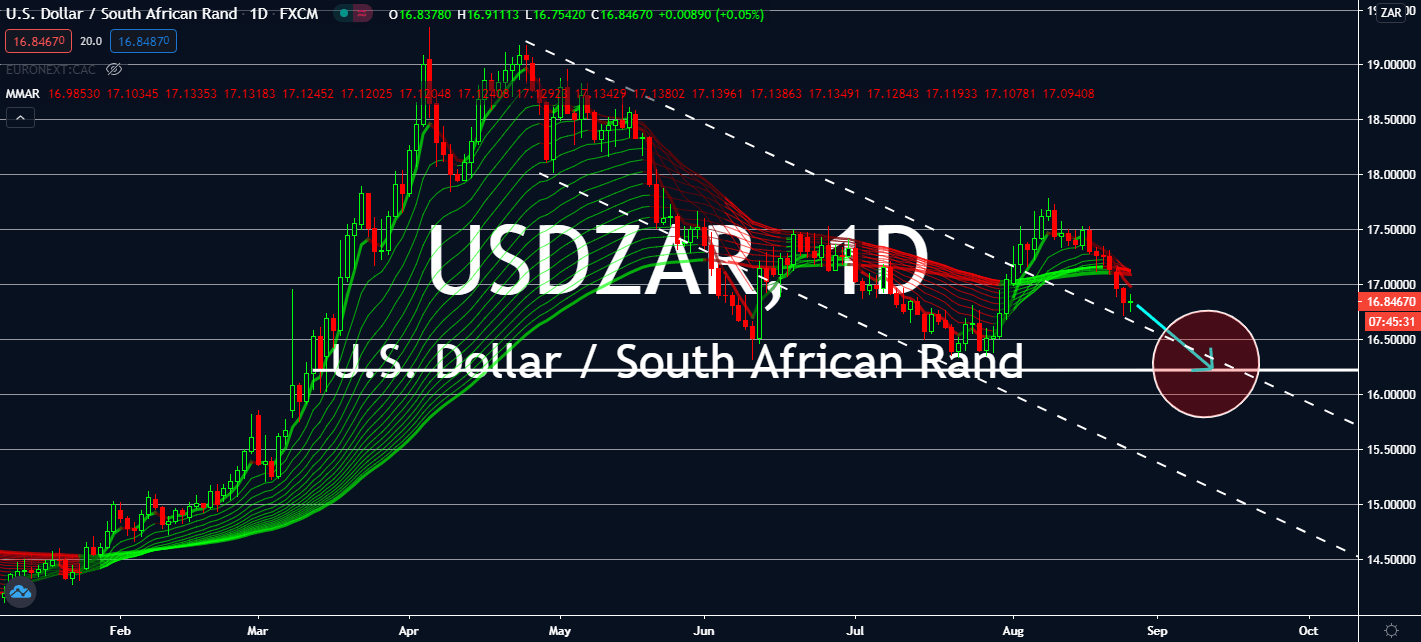
South Africa is projected to see the stars in today’s trading thanks to consumer inflation figures across the board. The country surprised the markets with a better Core CPI figure this year in comparison to 2019 when it came in at 3.2%, which is way up from its 2019 counterpart and the 3.0% the market had expected. The figure also grew on a monthly basis against June at 0.7%, up from both its prior estimate (0.5%) and previous record (0.3%), a telling sign that its economic recovery is going well with more demand stimulating its nationwide activity. CPI also boosted on a yearly basis from 2.2% to 3.2% this July. New Western-style shopping malls opened in small neighborhood stores and large open markets, which brought jobs, market expansions, new retail technology, and new goods and entertainment facilities for South Africans to enjoy.
AUDNZD
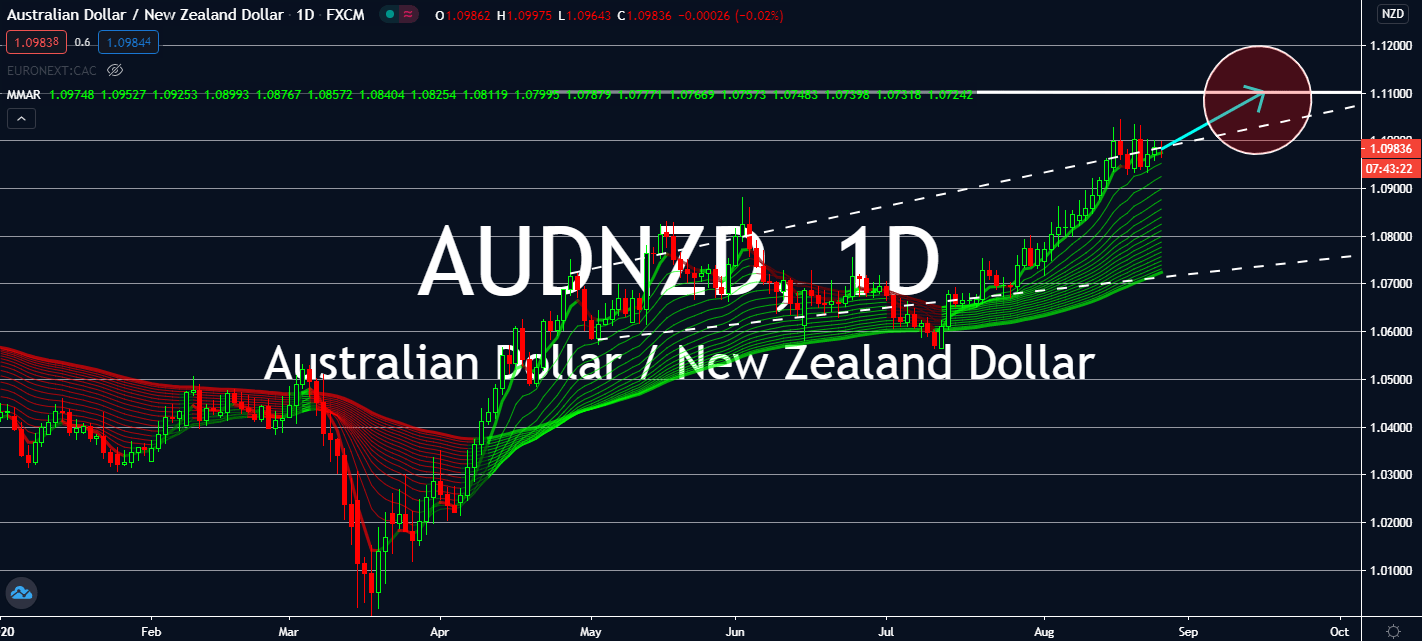
Risk sentiment is prepping itself to help the Australian dollar near-trade thanks to China’s economic recovery outshining New Zealand as of late. However, upcoming data from the Australian economy might pull what could be a bullish market in nearer terms driven by an upcoming announcement for Private New Capital Expenditures for the second quarter of this year in comparison to the first. Australian Bureau of Statistics is forecasted to report a deeper increase from -1.6% in the first quarter to -8.4%. This was after the first increase in more than 5 quarters. For now, New Zealand’s relatively shallow number of new coronavirus cases will help the kiwi dollar as Australia’s economic activity continues despite its own second wave in the city of Victoria. Australia’s involvement with other East Asia’s economic community will also help its currency boost and offset losses about to be seen in the region.
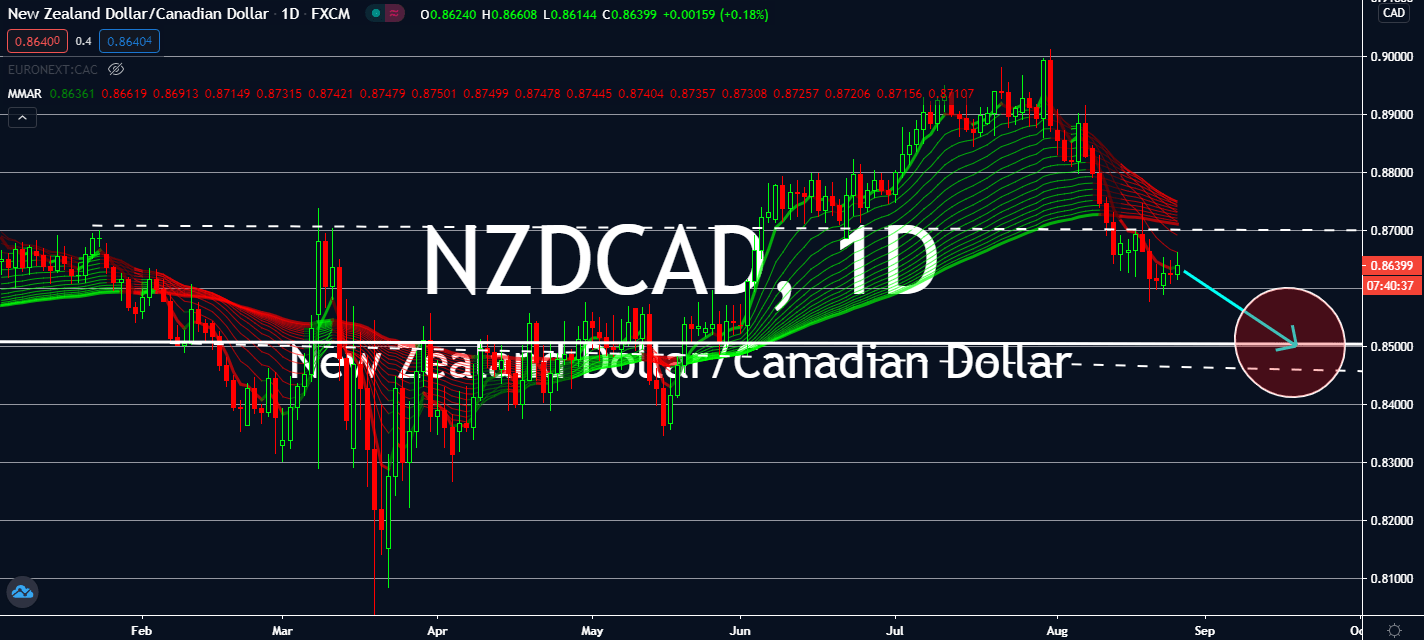
NZDCAD
The Bank of Canada might change its inflation expectations in late trading today. The pandemic is projected to test the public’s confidence in its previous 2% inflation target for end-2020 as it continues to fulfill its promise to keep inflation close to the said rate, which started from cutting its benchmark rates by three times year-to-date. Well-anchored inflation expectations will be tested further in the year, even as its recovery speeds faster than its American counterpart. Fortunately for the loonie, the central bank confirmed that if the reduction didn’t happen, Canada would have needed more monetary stimulus in the second half of this year. Now, domestic statistics claim that the average consumer thinks that they are facing higher inflation than its previous announcement, which is projected to help its currency lift near-term while investors brace themselves from what could be another interest rate decline in New Zealand.