Good day traders! Check now the most recent charts and market updates for today’s session. Learn more about analysis and be updated on the current happenings in the market!
USDHKD
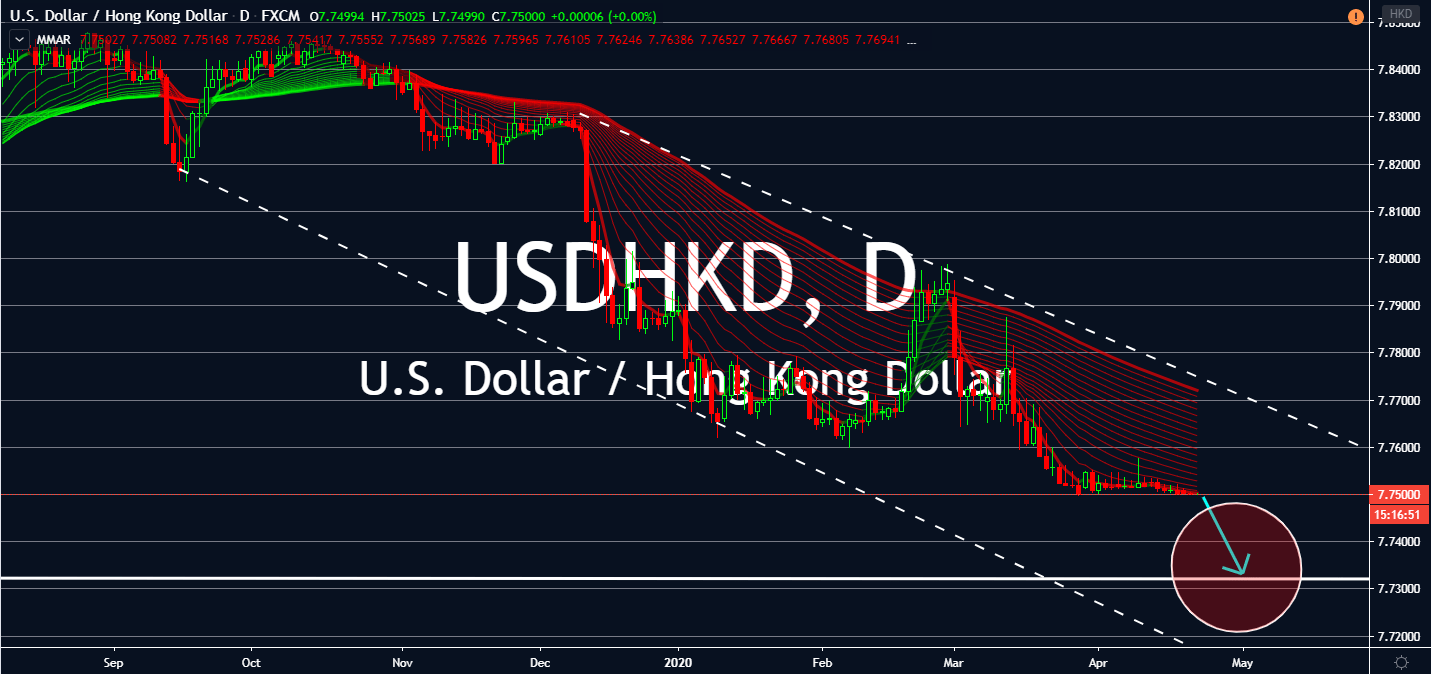
The Hong Kong dollar hasn’t seen much gain or loss against the greenback this week. This is due to investors’ engagement with other currencies outside the region. In fact, it hasn’t seen much movement since late February and is still descending in bear territory. That said, the greenback is still slumping notably against most of its counterparts. This is in courtesy of rapidly increasing crude oil supplies exceeding demand. It even reached an unprecedented value of $0.00, meaning oil costs much more to store than it does to sell.
The US core durable goods order figure is also expected to see a drop to -5.8% for the month of March. This is in comparison to the disappointing -0.6% figure seen the month prior. Markets should be careful with trading for the USD today, since the country is expected to announce lower initial jobless claims tomorrow. When compared to last week’s 5,245 K figure, markets predicted a slight reduction to 4,150 K.
USDSGD
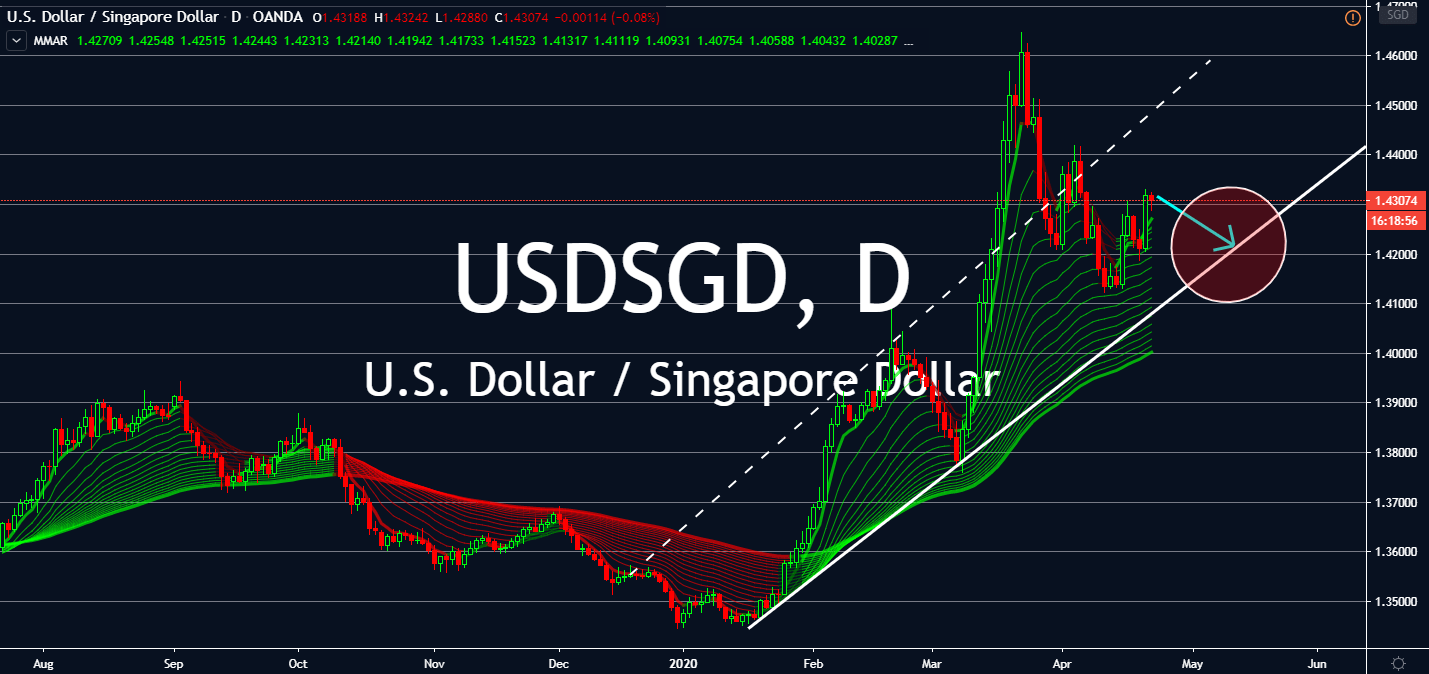
Although tomorrow’s announcement for Singapore’s consumer price index is expected to rattle the markets, the greenback will still weigh heavier for the pair. The US announced streams of bad news this week. It continues to overpower crude oil supply over demand despite its agreement with other OPEC giants earlier this month. This is proving that even with drastic movements to help oil, it would do nothing for engagement for the commodity without concrete demand from its main buyers in the transportation sector.
Furthermore, US core durable goods order figure is also expected to see a massive drop to -5.8% for March when compared to -0.6% in February. Investors also expect the US to announce a lower figure for its new home sales month-over-month in March. This is despite the increase in February when compared to the month prior. Coronavirus remains the main threat to both oil and real estate as investors see much less need for them currently.
EURDKK
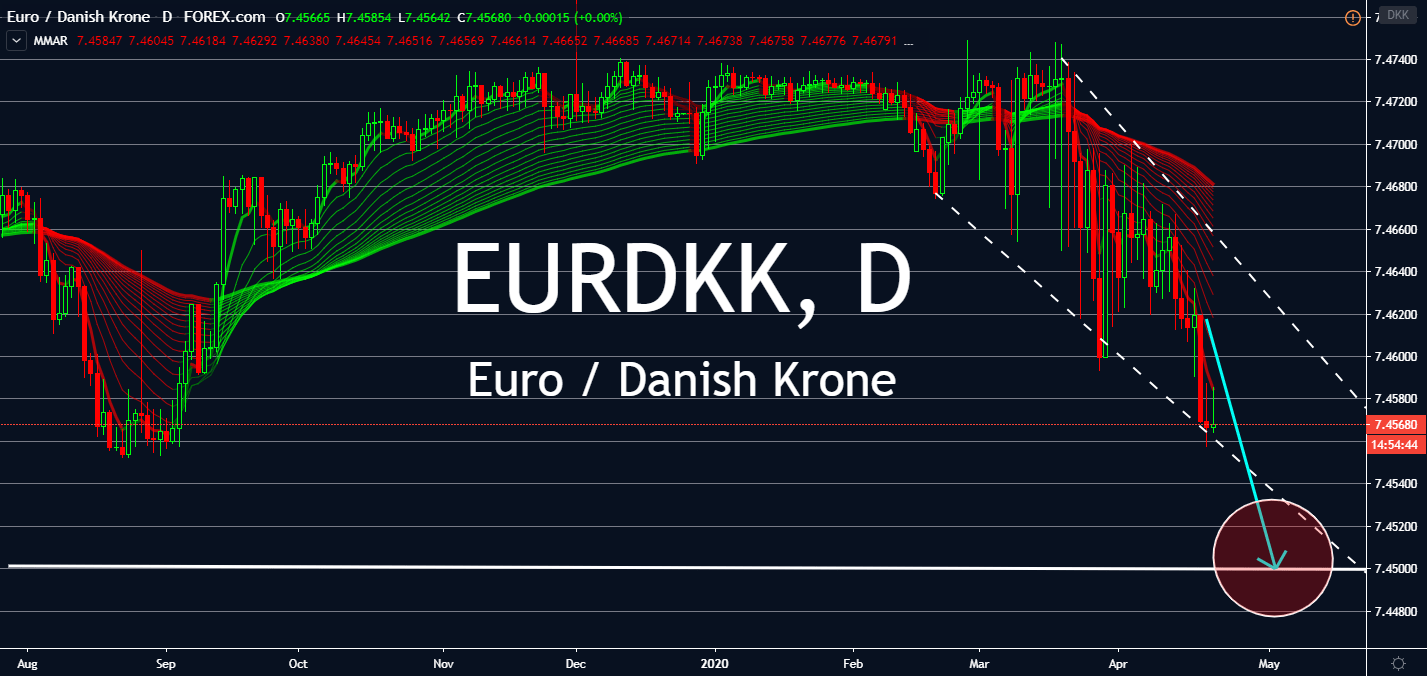
The euro/krone pair is facing one of its most volatile yet steepest drop, correcting itself to a figure seen back in September 2019 in the span of two months. The loss erased the bear market the Euro managed to gradually achieve since late October. Now, it looks like it’s only going to get even lower until the coronavirus subsides.
European investors are waiting on Germany’s manufacturing purchasing managers index figures tomorrow and its IFO business climate index on Friday, both expected to lower against the previous month’s. But this means nothing compared to their reactions to the European Union’s stimulus package to help its businesses. Its weak institutional framework disappointed investors, both by its slow reaction and lack of coverage to most businesses. The EU’s Economics Commissioner believes that a total of €1.5 trillion could be necessary for this, but the bloc hasn’t moved accordingly.
EURTRY
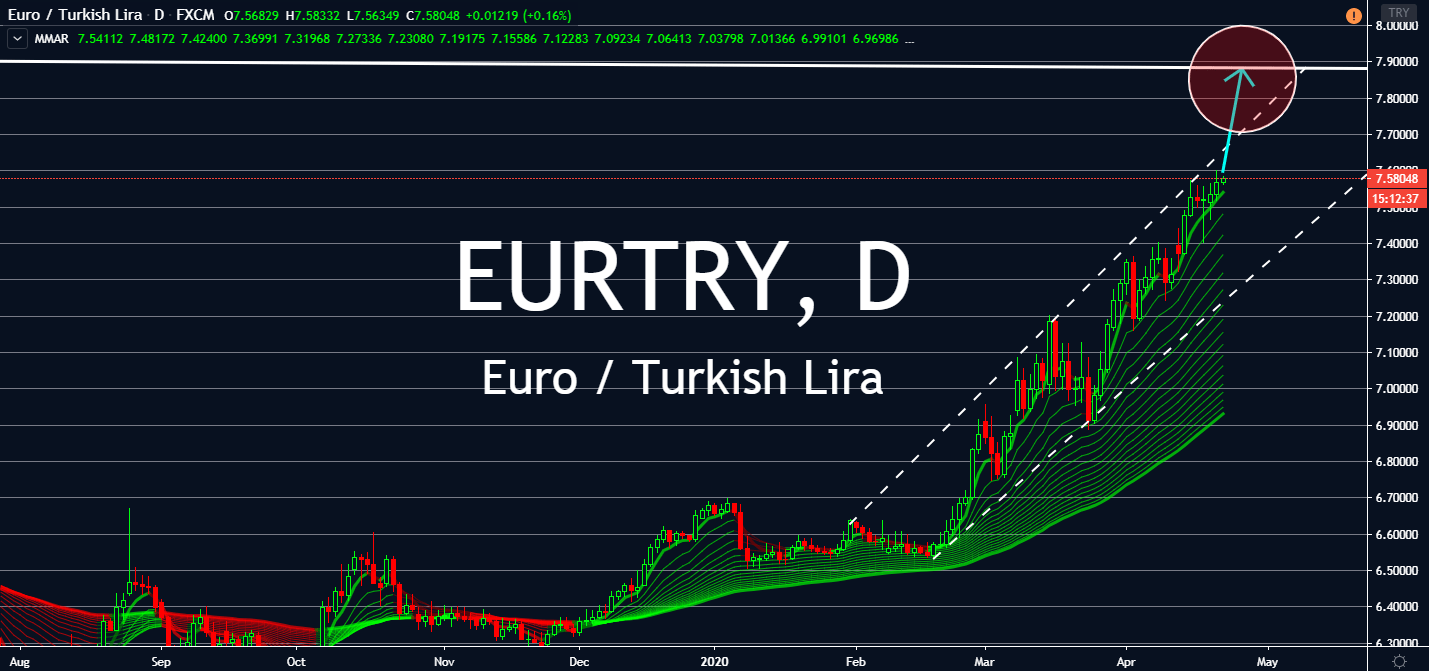
The euro has been seeing far more engagement for its currency over the Turkish lira as risk sentiment drives most markets. Turkey’s reputation as one of the slowest economies to act on the coronavirus has proved beneficial. It prompted investors to push the EURTRY pair upwards since February. Moreover, the Turkish government is ramping up its lockdown measures amid the month of Ramadan. This measure could not have been necessary if it acted on the virus sooner with much more aggressive, medical-centered movements.
It’s important to note that the Turkish lira also fell against its dollar opposition to its lowest figures since 2018. However, when paired with the Euro, it might not see many losses. Investors also grilled on the European Union for its slow, small fiscal stimulus package used to help the bloc’s businesses. They threw engagement on this week’s data out the window despite important upcoming figures, such as those in Germany’s manufacturing and business.